When Favourites Lose: Accuracy or Scoring Shot Production?

In today's post I'll review the performance of all the teams that have been assessed as favourites by the TAB in games played during the period 2006 to the end of Round 17 in 2015, excluding only those games where the TAB bookmaker installed equal-favourites.

Read More

Modelling Miscalibration

If you're making probability assessments one of the things you almost certainly want them to be is well-calibrated, and we know both from first-hand experience and a variety of analyses here on MatterOfStats over the years that the TAB Bookmaker is all of that.

Well he is, at least, well-calibrated as far as I can tell. His actual probability assessments aren't directly available but must, instead, be inferred from his head-to-head prices and I've come up with three ways of making this inference, using an Overround-Equalising, Risk-Equalising or an LPSO-Optimising approach.

Read More

Do Favourites Kick Straighter Than Underdogs?

We know that the TAB Bookmaker is exceptionally well-calibrated. Teams that he rates 80% chances win about 80% of the time and, more generally, teams that he rates X% chances win about X% of the time. Put another way, teams rated X% chances score more than their opponents X% of the time.

What about other scoring metrics, I wondered?

Read More

Bookmaker Overround: A General Framework

Previously I've developed the notion of taking a Bookmaker's prices in the head-to-head market and using them to infer his opinion about the true victory probabilities of the competing teams by adopting an Overround-Equalising or a Risk-Equalising approach. In this blog I'll be summarising and generalising these approaches.
Read More

Measuring Bookmaker Calibration Errors

We've found ample evidence in the past to assert that the TAB Bookmaker is well-calibrated, by which I mean that teams he rates as 40% chances tend to win about 40% of the time, teams he rates as 90% chances tend to win about 90% of the time and, more generally, that teams he rates as X% chances tend to win about X% of the time.
Read More

Optimising the Wager: Yet More Custom Metrics in Formulize

As the poets Galdston, Waldman & Lind penned for the songstress Vanessa Williams: "sometimes the very thing you're looking for, is the one thing you can't see" (now try to get that song out of your head for the next few hours ...)
Read More

An Empirical Review of the Favourite In-Running Model

In the previous blog we reviewed a series of binary logits that modelled a favourite's probability of victory given its pre-game bookmaker-assessed head-to-head probability and its lead at the end of a particular quarter. There I provided just a single indication of the quality of those models: the accuracy with which they correctly predicted the final result of the game. That's a crude and very broad measure. In this blog we'll take a closer look at the empirical model fits to investigate their performance in games with different leads and probabilities.
Read More

The Calibration of the Head-to-Head Fund Algorithm

In the previous blog we considered the logarithmic probability score on ProPred, WinPred and the TAB bookie and found that the TAB bookie was the best calibrated of the three and that relative tipping performance was somewhat unrelated to relative probability scores. For the Head-to-Head Fund, whose job in life is to make money, the key question is to what extent do its probability scores relative to the TAB bookie's shed light on its money-making prowess.
Read More

Assessing ProPred's, WinPred's and the Bookie's Probability Forecasts

Almost 12 months ago, in this blog, I introduced the topic of probability scoring as a basis on which to assess the forecasting performance of a probabilistic tipster. Unfortunately, I used it for the remainder of last season as a means of assessing the ill-fated HELP algorithm, which didn't so much need a probability score to measure its awfullness as it did a stenchometer. As a consequence I think I'd mentally tainted the measure, but it deserves another run with another algorithm.
Read More

All You Ever Wanted to Know About Favourite-Longshot Bias ...

Previously, on at least a few occasions, I've looked at the topic of the Favourite-Longshot Bias and whether or not it exists in the TAB Sportsbet wagering markets for AFL.

A Favourite-Longshot Bias (FLB) is said to exist when favourites win at a rate in excess of their price-implied probability and longshots win at a rate less than their price-implied probability. So if, for example, teams priced at $10 - ignoring the vig for now - win at a rate of just 1 time in 15, this would be evidence for a bias against longshots. In addition, if teams priced at $1.10 won, say, 99% of the time, this would be evidence for a bias towards favourites.

When I've considered this topic in the past I've generally produced tables such as the following, which are highly suggestive of the existence of such an FLB.

2010 - Favourite-Longshot Bias.png

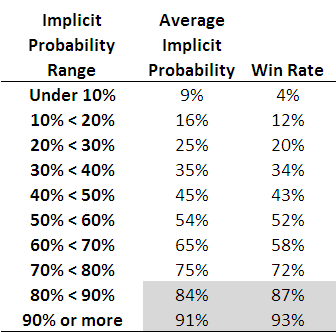
Each row of this table, which is based on all games from 2006 to the present, corresponds to the results for teams with price-implied probabilities in a given range. The first row, for example, is for all those teams whose price-implied probability was less than 10%. This equates, roughly, to teams priced at $9.50 or more. The average implied probability for these teams has been 9%, yet they've won at a rate of only 4%, less than one-half of their 'expected' rate of victory.

As you move down the table you need to arrive at the second-last row before you come to one where the win rate exceed the expected rate (ie the average implied probability). That's fairly compelling evidence for an FLB.

This empirical analysis is interesting as far as it goes, but we need a more rigorous statistical approach if we're to take it much further. And heck, one of the things I do for a living is build statistical models, so you'd think that by now I might have thrown such a model at the topic ...

A bit of poking around on the net uncovered this paper which proposes an eminently suitable modelling approach, using what are called conditional logit models.

In this formulation we seek to explain a team's winning rate purely as a function of (the natural log of) its price-implied probability. There's only one parameter to fit in such a model and its value tells us whether or not there's evidence for an FLB: if it's greater than 1 then there is evidence for an FLB, and the larger it is the more pronounced is the bias.

When we fit this model to the data for the period 2006 to 2010 the fitted value of the parameter is 1.06, which provides evidence for a moderate level of FLB. The following table gives you some idea of the size and nature of the bias.

2010 - Favourite-Longshot Bias - Conditional Logit.png

The first row applies to those teams whose price-implied probability of victory is 10%. A fair-value price for such teams would be $10 but, with a 6% vig applied, these teams would carry a market price of around $9.40. The modelled win rate for these teams is just 9%, which is slightly less than their implied probability. So, even if you were able to bet on these teams at their fair-value price of $10, you'd lose money in the long run. Because, instead, you can only bet on them at $9.40 or thereabouts, in reality you lose even more - about 16c in the dollar, as the last column shows.

We need to move all the way down to the row for teams with 60% implied probabilities before we reach a row where the modelled win rate exceeds the implied probability. The excess is not, regrettably, enough to overcome the vig, which is why the rightmost entry for this row is also negative - as, indeed, it is for every other row underneath the 60% row.

Conclusion: there has been an FLB on the TAB Sportsbet market for AFL across the period 2006-2010, but it hasn't been generally exploitable (at least to level-stake wagering).

The modelling approach I've adopted also allows us to consider subsets of the data to see if there's any evidence for an FLB in those subsets.

I've looked firstly at the evidence for FLB considering just one season at a time, then considering only particular rounds across the five seasons.

2010 - Favourite-Longshot Bias - Year and Round.png

So, there is evidence for an FLB for every season except 2007. For that season there's evidence of a reverse FLB, which means that longshots won more often than they were expected to and favourites won less often. In fact, in that season, the modelled success rate of teams with implied probabilities of 20% or less was sufficiently high to overcome the vig and make wagering on them a profitable strategy.

That year aside, 2010 has been the year with the smallest FLB. One way to interpret this is as evidence for an increasing level of sophistication in the TAB Sportsbet wagering market, from punters or the bookie, or both. Let's hope not.

Turning next to a consideration of portions of the season, we can see that there's tended to be a very mild reverse FLB through rounds 1 to 6, a mild to strong FLB across rounds 7 to 16, a mild reverse FLB for the last 6 rounds of the season and a huge FLB in the finals. There's a reminder in that for all punters: longshots rarely win finals.

Lastly, I considered a few more subsets, and found:

  • No evidence of an FLB in games that are interstate clashes (fitted parameter = 0.994)
  • Mild evidence of an FLB in games that are not interstate clashes (fitted parameter = 1.03)
  • Mild to moderate evidence of an FLB in games where there is a home team (fitted parameter = 1.07)
  • Mild to moderate evidence of a reverse FLB in games where there is no home team (fitted parameter = 0.945)

FLB: done.