Assessing ProPred's, WinPred's and the Bookie's Probability Forecasts
/Almost 12 months ago, in this blog, I introduced the topic of probability scoring as a basis on which to assess the forecasting performance of a probabilistic tipster. Unfortunately, I used it for the remainder of last season as a means of assessing the ill-fated HELP algorithm, which didn't so much need a probability score to measure its awfullness as it did a stenchometer. As a consequence I think I'd mentally tainted the measure, but it deserves another run with another algorithm.
So, the logarithmic probability score will be reappearing this year - though, mercifully, the HELP algorithm will not - as a means of assessing the probabilistic forecasting merits of the two new tipster algorithms, ProPred and WinPred, and of the algorithms underlying the Head-to-Head and Line Funds, both of which also output probabilities. With the version of the method I'll be applying this year, a forecaster will earn 1+log(p) (in base 2) for each prediction, where p is the probability it assigned to the winning team. The most that can be earned from any single tip is 1, where a probability of 1 is assigned to the winning team, the least that can be earned is negative infinity, where a probability of 0 is assigned to the winning team, and a coin-toss 50% prediction always earns 0. An algorithm therefore needs a cumulative positive score to be doing better than chance.
Let's firstly take a look at how ProPred and WinPred performed across seasons 2007 to 2010 on this probability score metric relative to the TAB Sportsbet bookmaker.

Overall, ProPred does better than WinPred, which is as it should be given that ProPred was developed as a probability predicting algorithm, but it does less well than the TAB Sportsbet bookmaker. If we break the home-and-away season into four roughly equal pieces and we treat the Finals separately, we see that ProPred outperforms WinPred in every season segment except for the final five home-and-away rounds of the season.
ProPred trails the bookmaker in every season segment except Rounds 12 to 17, which are also the rounds, if memory serves me, that many of our MAFL Funds have revived in seasons past.
Also, with the exception of WinPred in the Finals, both algorithms and the bookmaker have positive average probability scores per game for each season segment, meaning that they've all forecast better than chance.
Though it's tempting to make comparisons across season segments and conclude, for example, that the bookmaker has performed more poorly in Rounds 1 to 6 than in any other segment of the season, this temptation must be resisted. A probability score across one series of games can be lower than for another series either because the forecaster did a poorer job in making probability assessments or because one series of games was inherently more difficult to predict than the other in that it included a higher proportion of games between closely-matched teams. These two factors cannot be objectively separated, so the only appropriate comparisons to make using this measure are between two or more sets of forecasts for the same set of events.
With a little maths it's not hard to show that, across a series of games, a forecaster's maximum probability score will be obtained when it attaches a probability of victory of X% to teams that win X% of the time. So, as one means of diagnosing where the bookmaker derives his superiority over the two Preds we can look at the calibration of his and their probability forecasts across various probability ranges.

A forecaster that is well-calibrated - and thus one who will tend to score well on the logarithmic probability score - will register accuracy scores in each row of the bottom half of the table roughly equal to the mid-point of the probability range that the row covers. So, for example, in the 60% < 70% row, the forecaster will record an accuracy of around 65%.
In the top half of the table where the forecasted probability for the home team is below 50%, a well-calibrated forecaster will record an accuracy of equal to 100 minus the mid-point of the probability range that the row covers. So, for example, in the row labelled 30% < 40%, a well-calibrated forecaster will also record an accuracy of around 65%.
I've shaded in gray those cells where a forecaster is particularly poorly calibrated, that is where the accuracy is 8% points or more different from optimal, from which you can see that ProPred and WinPred both do poorly in games where they feel that the home team should be priced at $4 to $6. The bookie also does somewhat poorly with home teams priced at around the $4 mark - though less poorly than ProPred and WinPred - and with those priced at around $1.15.
Before moving on to looking at the Head-to-Head Fund's algorithm, here's a table showing the tipping performance of ProPred, WinPred and the TAB bookie overall and by season segment.
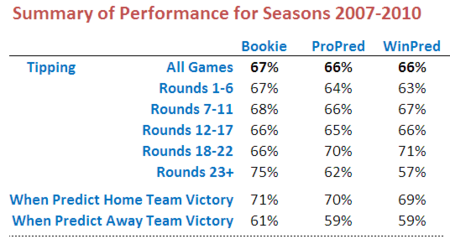
Over the four seasons 2007 to 2010, ProPred and WinPred both tip at about the same rate, a little less than the TAB bookie. The TAB bookie prevails in most season segments except Rounds 18 to 22.
One thing that this table highlights when compared with the earlier one showing probability scores is the difference between predictive accuracy and calibration. For example, both ProPred and WinPred have superior probability scores to the TAB bookie in the Round 12 to 17 season segment, but they don't out-tip the bookie for this segment. Conversely, the TAB bookie has the superior probability score for the Round 18 to 22 segment, but has a poorer tipping record. To tip well you just need to know which side of 50% is the correct probability to attach to a team; to score well on the logarithmic probability score you need to know how far from 50% to venture.
In the next blog I'll look at the probability scoring performance of the Head-to-Head Fund's algorithm.
