Do Favourites Kick Straighter Than Underdogs?
/We know that the TAB Bookmaker is exceptionally well-calibrated. Teams that he rates 80% chances win about 80% of the time and, more generally, teams that he rates X% chances win about X% of the time. Put another way, teams rated X% chances score more than their opponents X% of the time.
What about other scoring metrics, I wondered? What is the relationship between a team's pre-game victory probability and the likelihood that it scores more goals, scores more behinds, records more scoring shots, or finishes with a superior scoring shot conversion rate than its opponent? A priori it seemed reasonable to expect that these proportions might also reflect the level of favouritism so that, for example, an 80% favourite would kick more goals than the underdog about 80% of the time, kick more behinds about 80% of the time, register more scoring shots about 80% of the time, and record the superior conversion rate about 80% of the time.
Empirically, how reasonable do these a priori intuitions turn out to be? The chart below summarises the 1,536 games played during seasons 2006 to 2013 inclusive, and shows that the intuitions were borne out reasonably well by the data for the goals scored and scoring shots registered metrics, somewhat borne out by the behinds scored metric, and not borne out at all by the conversion rate metric (ie the ratio of goals to scoring shots).
The chart plots the proportion of games in which favourites with implicit probabilities -calculated using the Risk-Equalising approach for this blog - within a certain range recorded superior performance relative to the underdog on a certain scoring metric. The black line tracks the performance we'd expect if my a priori intuitions were correct and favourites turned out to be superior on a metric in direct proportion to their pre-game probability.
(Technical note: for this chart I identified the nine breakpoints in implicit probabilities that put approximately 10% of games into buckets defined with those breakpoints as the boundaries. I then plotted the result for each bucket against the mid-point probability for that bucket. For all metrics, for games where there were equal favourites or the teams were tied on the relevant metric I scored it as a half-success for the favourite.)
Solid red blocks track the bookmaker's calibration as they represent the proportion of games won by favourites in the range of probabilities being considered for that point. The fact that these red blocks rarely stray far from the black line reflects the general excellence in calibration of the TAB bookmaker's probability assessments across the entire range of favouritism, from narrow to raging.
The orange circles and black line segments record the results for the favourites' scoring shot and goal-scoring superiority and, like the red blocks of calibration, stay generally close to the black line of expectation. There is a portion of the plot though, from probabilities of about 68% to 76%, where all of the data points including the red blocks dip below the black line, this being the one area where the TAB Bookmaker has shown any signs, however slight, of mild miscalibration.
Behind-scoring superiority, recorded here as blue circles, tracks below the black line for a much larger set of probabilities, however, denoting that favourites, while generally scoring more behinds in a game than underdogs, do so in proportions a little less than their pre-game price might lead you to expect. For example, favourites with probabilities in the 84-90% range, the second-last point plotted from the right, score more behinds than the underdog teams they face only 72% of the time.
Whilst this result for behind-scoring superiority is a little surprising, it's still true that favourites tended to outperform underdogs on this metric more than half the time.
Far more surprisingly, the same cannot be said of the conversion metric. In games where the pre-game favourite is rated between about 55% and 80%, underdogs produce better conversion rates about 52% of the time.
This could make for a quite lucrative proposition bet: in games where the favourite is priced say in the range $1.20 to $1.70 offer to take the underdogs at anything over $2 - because, after all, you are taking the underdogs - to finish the game with the superior conversion rate. If you're feeling particularly bold, request that ties in the conversion rates are treated as wins for you - because, after all, you are ... you get the idea.
So, what's going on here?
A couple of other pieces of information are illuminating. It turns out that when favourites win they produce a superior conversion rate a little over 60% of the time but, when they lose, they do so only about 25% of the time. From this you can deduce that underdogs produce superior conversion rates when they win about 75% of the time and superior conversion rates when they lose about 40% of the time. If you think about it for a moment, this makes sense: a favourite is more likely to be able to win on the basis purely of superior scoring shot creation while an underdog more often needs to make better use of the scoring shots it generates in order to emerge victorious.
The rates at which favourites of differing strength emerge with superior conversion rates depending on whether they win or lose is shown in the chart below.
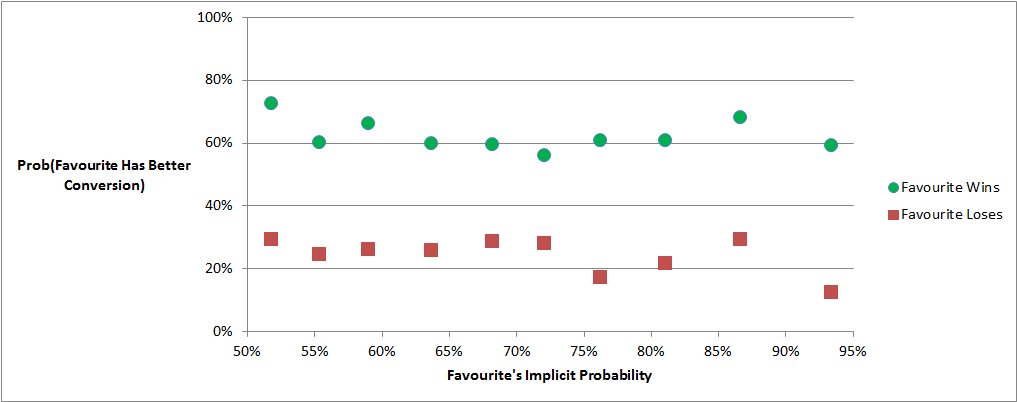
For a favourite to finish with a superior conversion rate they can either:
- Win the game and then, with about 60% probability, finish with a superior conversion rate
- Lose the game and then, with about 25% probability, finish with a superior conversion rate.
Consider then a 65% favourite. It will win about 65% of the time and, in 60% of these cases, finish with a superior conversion rate. The other 35% of the time it will lose and in only 25% of these cases will it finish with a superior conversion rate. Overall then, the probability that it finishes with a superior conversion rate is given by 65% x 60% + 35% x 25%, which is 48%, about what we saw in the earlier chart.
Roughly speaking, the proportion of games in which a favourite achieves a superior conversion rate is a weighted sum of the 60% rate at which it does so when it wins and the 25% rate at which it does so when it loses. The weights are the rates at which it wins and loses.
Or, as an equation:
Prob(Favourite Has Superior Conversion Rate)
= Prob(Favourite Wins) x Prob(Favourite Has Superior Conversion Rate given that it Wins) + (1-Prob(Favourite Wins)) x Prob(Favourite Has Superior Conversion Rate given that it Loses)
= Pre-Game Probability x 60% + (1-Pre-Game Probability) x 25%
It's only when a team's favouritism reaches very high levels that the weighting on the 60% figure is sufficiently high and that on the 25% figure is sufficiently low that the final weighted sum creeps much over 50%.
In fact, taken across all 1,536 games, the favourite attained the superior conversion rate only 51% of the time.
