Measuring Bookmaker Calibration Errors
/We've found ample evidence in the past to assert that the TAB Bookmaker is well-calibrated, by which I mean that teams he rates as 40% chances tend to win about 40% of the time, teams he rates as 90% chances tend to win about 90% of the time and, more generally, that teams he rates as X% chances tend to win about X% of the time.
To make a definitive assessment of his calibration levels, however, we need a methodology to convert his pre-game prices into probability assessments. That requires us to unwind the profit margin or "overround" that he has embedded in each team's pricing. To do this, typically I've made the simple assumption that he levies overround equally on both teams, from which is follows that:
Implicit Probability of the Home Team = Away Team Price / (Home Team Price + Away Team Price)
The assumption of equally-levied overround has looked broadly reasonable in the past, though at least one empirical analysis we've done has expressed a contrary view, and I've always had my suspicions about the overround levied on very short-priced favourites and heavy underdogs.
For today's blog I want to, firstly, approach the issue of overround from a more theoretical viewpoint to motivate a new way of turning prices into implicit probabilities.
Time then for a little algebra (okay, rather a lot really).
MINIMUM CALIBRATION ERROR REQUIRED FOR PROFITABLE WAGERING
Consider a bookmaker who estimates a team's victory probability to be p, and who intends to add overround o to the price of this team where I'm deviously defining overround such that:
Price = 1 / [(1+o) x p]
Now this bookmaker wants to ensure that he'll still make a profit, on average, even if his calibration error is some positive value e - that is, even if the true victory chances for the team in question are p+e, not p. (He's not worried if his calibration error is negative because then he'd be underpricing the team and bolstering its profitability to him rather than reducing it.)
With the price as specified above and a true victory probability of p+e, the Bookmaker's expected return from such a wager is given by:
E(Return) = 1 - (p+e)/[(1+o) x p]
For this to be positive we need
o > e/p
In other words, the overround embedded in the price offered needs to be greater than the calibration error he wants to protect against, divided by the Implicit Probability he's using as a basis for the price. The breakeven point is where o = e/p.
(Turns out that I derived a similar result some time back in this blog, but there I defined overround differently - with the benefit of hindsight I'd now claim less elegantly. I also completely failed to recognise the broader implications of this result at the time. I'm claiming "older and wiser" status now rather than "slow on the uptake" then. You decide.)
One interesting aspect of this result is that it provides motivation for higher levels of overround on underdogs and lower levels on favourites for any bookmaker who wants to guard against equally-sized calibration errors, in percentage point terms, on underdogs and favourites alike.
Consider, for example, games from the most recent season where the typical overround has been 6%. Applying that level of overround to a rank underdog, say a team with an implicit probability of 10%, would provide "cover" only for calibration errors of 0.6% or less. Put another way, if the underdog's true probability were 11%, just 1% higher than the bookmaker's assessment, then pricing the team based on a 10% Implicit Probability with a 6% overround would result in a wager with a negative expectation for the bookmaker. Overround provides substantially less cover for any team with a small Implicit Probability.
It seems more likely, therefore, that the bookmaker would ratchet up overround on underdogs, and ratchet it down on favourites in order to maintain a set level of aggregate overround without being exposed to excessive risk on either team. (Favourite-longshot bias anyone?)
SETTING OVERROUNDS TO GUARD AGAINST EQUALLY-SIZED CALIBRATION ERRORS
So, let's assume that the bookmaker sets the overround on each team to ensure that it provides for, at worst, a breakeven outcome given equally sized calibration error for both teams.
To achieve this we need:
For Team 1 : o1 = e/p1 and,
For Team 2 : o2 = e/p2
where o1 is the overround (in the sense I've used it above) for Team 1, p1 is the implicit probability for Team 1, e is the assumed maximum calibration error for both teams, and o2 and p2 are defined for Team 2 equivalently to o1 and p1 for Team 1.
Rearranging this gives us:
o1/o2 = p2/p1
Which is quite a neat result (but perhaps not adequate justification for a sentence fragment, but there we are). It says that, in order for the overrounds to provide cover for the same sized calibration error for both teams, the ratio of the overrounds needs to be the reciprocal of the ratio of the implicit probabilities.
Bookmakers adopting this approach will opt for much larger overrounds on longshots than on favourites. For example, using this equation, a team with a 10% implicit probability will have 9 times the overround of the 90% favourite in the same game (where, again, I'm using overround in the sense described earlier).
CHOOSING AN OVERALL OVERROUND
Given that a bookmaker is operating with the philosophy just described, the last piece we need to allow us to convert his revealed team prices into Implicit Probabilities is to somehow constrain o1 and o2.
We know that, for any given game, the actual total overround is known and is, by definition, the sum of the reciprocal of the revealed prices (minus 1 if I'm to be consistent in my use of overround in this blog so far).
Let's call that sum 1+T, a constant for any given game.
Now we also know that, by definition, the Bookmaker sets:
Price1 = 1 / p1(1+o1) and
Price2 = 1 / p2(1+o2) = 1 / (1-p1)(1+o2)
The total overround, 1+T, is given by the sum of the reciprocal of these prices, hence:
1+T = p1(1+o1) + (1-p1)(1+o2)
which, using the fact that o2 = p1 x o1/(1-p1), allows us to derive:
p1 = T / 2o1
Lastly, using the fact that Price1 = 1/p1(1+o1), we can derive that:
p1 = 1/Price1 - T/2 and
p2 = 1/Price2 - T/2
And we're there. We can now come up with implicit probabilities for both teams using only the observed market prices and the observed total overround on the game.
It's time for some terminology. I'm going to label the approach of setting prices based on levying overround equally on each team the "Overround Equalising" approach, and the alternative approach of setting prices based on ensuring they provide equal cover for both teams in terms of calibration error as the "Risk Equalising" approach.
HOW DIFFERENT IS RISK-EQUALISING FROM OVERROUND-EQUALISING?
For the most part, the difference between the two pricing approaches is very small.
The charts below is a scatterplot of the Implicit Probabilities produced for the same game using the two approaches.
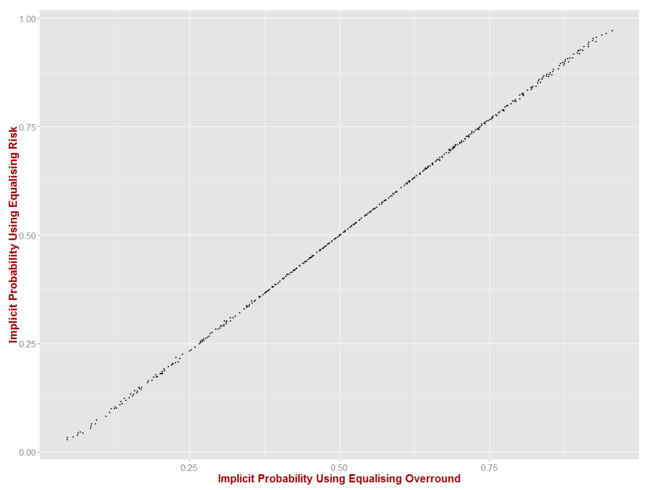
The maximum difference in the two approaches is small - no more than about 3% points even at the extremes. Still, as we now know, even 3% points can be decisive.
WHICH APPROACH PRODUCES BETTER-CALIBRATED PROBABILITIES?
Using the Implicit Probabilities calculated using both approaches, here are the calibration curves produced by the R package ROCR for every game from 2006 to 2012.

Each dot on each chart represents a group of games where the Implicit Probability is equal to or near the value shown on the x-axis. The y-value for any dot is the absolute difference between this Implicit Probability and the actual winning rate of the Home teams in these games, so large y-values signify larger absolute calibration errors.
The blue line is a loess smoothed estimator of the dots and is what we should focus on, I'd contend, to make some sense of the dots. What we see is that the smoothed calibration errors for the Risk-Equalising approach lie in a narrower range and hover mostly around the 5% point mark, drifting very slightly higher for Home teams with implicit probabilities around the 30%, 55% and 85% levels.
That's all very well, but for wagering purposes we need to know whether the Home teams tend to be underpriced or overpriced at these levels? The chart above shows only average absolute calibration error, so we can't use it to answer this question.
Enter the calibration chart from the val.prob function of the rms package. It's by no means as pretty as the ggplot chart above, but it's packed with useful information.
(Please click on this or any other image in this blog to access a larger version.)

For a full description of this chart, please refer to the documentation for the val.prob function linked above, but for our purposes it suffices to know that:
- The dashed line shows what a perfectly-calibrated predictor would look like, with all teams assessed as having victory probability of p winning p% of the time
- The solid line shows the results of a logistic regression fitted to the actual results and the predicted (ie Implicit) probabilities. Bear in mind that such a regression has only two parameters, an intercept and a slope, so it will sometimes struggle to fit all the twists and turns of the underlying data
- The dotted line is a non-parametric fit of the actual and predicted probabilities. It provides a better fit to the actual data but is highly non-linear and is not constrained to the interval (0,1). It might, therefore, suffer from overfitting
- The ticks at the bottom of the chart reflect the relative prevalence of predictions of the relevant probability
- The numbers in the top left include:
- Dxy, which the correlation between the implicit probabilities and the 0/1 result variable. Positive and higher is better, and +1 is perfect (and largely, like most forms of perfection, unattainable)
- C (ROC), which is the area under the relevant ROC curve and which measures the general discrimination ability of the predictor where 1 is perfect and 0.5 represents prediction at random. One interpretation of this measure is that it represents the probability that the predictor would provide a higher estimated probability for a randomly selected winning team than it would for a randomly selected losing team
- R2, which is a pseudo-R-squared measure where, again, +1 is perfect and now 0 reflects randomness
- D, the Discrimination Index, which is another measure of the discriminating power of the predictor where 1 is perfect and 0 is embarrassing
- Brier, the Brier Score, which is a probability score for the predictor ranging between 0 and 1, the smaller the better
- E_max, which the maximum absolute calibration error when the fitted logistic is used to estimate probabilities. Smaller, obviously, is better
- S:z is the Spiegelhalter Z-test for calibration accuracy, the null hypothesis for which is that the actual probability is equal to the predicted probability for all values of the actual probability; S:p is the relevant p-value for this test and we'd prefer it to be large so that we can fail to reject the null hypotheisis
The Implicit Probabilities produced using the Risk-Equalising approach (see the right-hand chart) are superior to those produced using the Overround-Equalising approach (see the left-hand chart), if only marginally, in that the main diagnostics are mostly unchanged, the pseudo R-squared is a fraction higher, and the maximum calibration error declines from 3.7% to 3.2% as a consequence of improved calibration for short-priced Home team favourites.
Taking all the diagnostic measures and tests into account and focussing on the Implicit Probabilities produced using the Risk-Equalising approach, I think it's fair to say that the calibration of the TAB Bookmaker is very good, but not perfect. As evidence for the efficacy of the TAB Bookmaker's probability assessments, the Spiegelhalter Z-test, for example, comfortably fails to reject the null hypothesis as described above, the maximum calibration error is less than 3.2% across the entire range of probabilities, and the area under the ROC curve is over 75%.
Nonetheless, we saw in the earlier chart some signs of miscalibration of the Bookmaker's Implicit Probabilities in the vicinity of 30%, 55% and 85%. The fitted logistic line supports this observation and suggests that Home teams tend to be especially miscalibrated in the 30% to 80% range since the fitted logistic lies above the Ideal line in that range of probabilities. The non-parametric line provides confirmation of the miscalibration in this range too but also, because its additional flexibility, is able to flag the lower levels of miscalibration around 60% - the logistic functional form is constrained to have just two inflexion points, but the non-parametric functional form can have as many as it sees fit, for better or for worse.
A look at the raw data reveals that:
- Home teams with an Implicit Probability in the 25 to 35% range (for which the average Implicit Probability was 30%) win at about a 34% rate
- Home teams with an Implicit Probability in the 45 to 55% range (for which the average Implicit Probability was 50%) win at about a 52% rate, and those in the 55 to 65% range (for which the average Implicit Probability was 59%) win at about a 60% rate
- Home teams with an Implicit Probability in the 75 to 85% range (for which the average Implicit Probability was 80%) win at about an 88% rate.
All of which lends some weight to the argument that Home teams are mildly but systematically mispriced most often when their Implicit Probabilities are around 30%, 55% and 85%, which equate to prices of about $3, $1.70 and $1.15 assuming a total overround of 6%.
Moreover, the raw data shows that Home teams in whatever price range tend to win at a rate at least slightly higher than their Implicit Probability would indicate.
The summary then is that, from a Home team view of the data, the TAB Bookmaker is generally well-calibrated across the entire range of probabilities, though he tends to price Home teams somewhat generously whatever their rated chances but especially so within a few narrow price ranges.
TEAM-BASED CALIBRATION
Maybe analysing the data based solely on the Home/Away team dichotomy masks opportunities that would be laid bare by an alternative analysis.
What about, for example, the view by team, whether playing at home or away?

(GWS and Gold Coast have been excluded here because they have too few games from which to draw any meaningful conclusions.)
Let me, somewhat arbitrarily, deem that a minimum 10% absolute calibration error is required to pique our interest. We have, after all, only a relatively small sample for each team, so any fitted models will be subject to non-trivial levels of sampling error. A case could be made to investigate smaller calibration errors for lower Implicit Probabilities since we know that these might be more exploitable for profit, but I'll ignore that for now.
On the basis of the 10% rule, only Carlton, Collingwood, Essendon, Fremantle and Port Adelaide offer any significant promise.
Again, to find out whether the calibration errors tend to be the result of over- or under-pricing, we call on the services of the val.prob function.


Based on the Brier Scores in these charts, the teams that the TAB Bookmaker has most-accurately priced across the last 7 seasons have been Melbourne, Geelong, Western Bulldogs, West Coast and the Brisbane Lions, while the teams he's least-accurately priced have been Essendon, Port Adelaide, Adelaide and Carlton.
The opportunities with the least-accurately priced teams have been, for Essendon, Port Adelaide and Carlton, when they've carried an Implicit Probability above about 60%. In these games, betting against the Dons, the Power or the Blues would have been the preferred strategy as they've won at much lower rates than their Implicit Probability, and hence price, would suggest was expected.
For Adelaide, while the overall fit of actual versus predicted probability is relatively poor, this is mostly due to moderately poor fits across large ranges of Implicitly Probabilities rather than to especially poor fits in one or two contiguous Implicit Probability ranges. As such, the poor fit for the Crows look less exploitable than for the three teams listed above, even in hindsight.
(I should caveat here that the exploitability of any calibration error, even if real, depends not just on its size but also on whether it occurs for large or small Implicit Probabilities since, as we learned earlier, miscalibration of underdogs provides greater opportunity than miscalibration of favourites.)
Though the Brier Score for the Bookmaker's prediction for the Pies is not amongst the worst, there nonetheless appears to be some exploitable opportunity for them when their Implicit Probability is in the 30% to 60% range, on which occasions they've tended to win more often than their Implicit Probability would indicate.
All that said, in summary I'd be reticent to make any firm calls about the practical exploitability of any of the identified miscalibrations for a particular team and a particular Implicit Probability range identified in this section, simply because the estimates are based on so few data points. We have, in total, only about 150 to 160 observations for each team, and only a fraction of that for any combination of team and contiguous Implicit Probability range.
It is though reasonable to conclude that there are teams the TAB Bookmaker has consistently priced well across all Implicit Probabilities values, and teams that he's priced less well. So, for example, if other data led you to suspect that the Dons might have been mispriced in a particular game, I'd let the analysis here alter your Bayesian Prior but not totally determine it.
ROUND-BASED CALIBRATION
We've shown that the TAB Bookmaker tends to struggle a little more in pricing some teams rather than others. Might he also struggle to price all teams at one stage of the home-and-away season compared to another stage?
For this next analysis we divide the home-and-away seasons into four not-quite-equal parts.
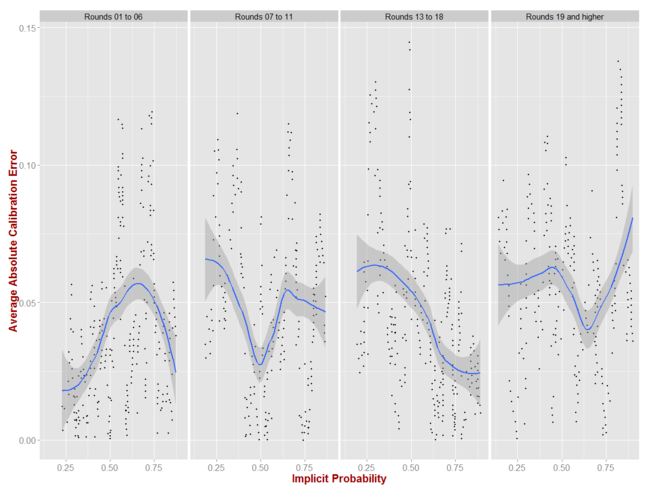
These charts are all produced with the Implicit Probability calculated from the perspective of the Home team and suggest that little significant miscalibration occurs in any particular part of the season. If there's any opportunity at all, it's with Home team underdogs from Round 7 onwards and with Home team short-priced favourites in the latter part of the season. Even then the miscalibration is mostly just marginally above 5% points, which is unlikely ro be profitably exploitable, especially for short-priced favourites.
These conclusions are merely underscored by the output from the val.prob function (focus on the non-parametric fits).

It's interesting to note how well-calibrated the TAB Bookmaker has been during the first 6 rounds of the season, which is when many MAFL Funds have been inactive because I've assessed them as being less profitable based on historical data.
SUMMARY AND CONCLUSION
Here's what I've learned from putting this blog together (and this one's taken much longer than most):
- There's reasonable, theoretical motivation for bookmakers to embed more overround in their prices for longshots than in their prices for favourites
- We can estimate this differential overround imposition by making a plausible assumption about the bookmaker's attitude towards protecting against calibration error. This allows us to employ a slightly different approach to calculating Implicit Probabilities
- The TAB Bookmaker is very well-calibrated, but perhaps slightly less well for:
- Home teams priced around $1.15, $1.70 and $3.00
- Essendon, Port Adelaide, Adelaide and Carlton
- Games from Rounds 7 onwards
- He's particularly well-calibrated for:
- Home teams that are heavy favourites or near equal favourites
- The Brisbane Lions, Geelong, Melbourne, West Coast and the Western Bulldogs
- Games in Round 1 to 6 of the home-and-away season
On the strength of what we've found here I'm curious to know whether existing MAFL Fund algorithms might benefit from using the Risk Equalising approach to estimating Implicit Probabilities.
