Optimising the Wager: Yet More Custom Metrics in Formulize
/As the poets Galdston, Waldman & Lind penned for the songstress Vanessa Williams: "sometimes the very thing you're looking for, is the one thing you can't see" (now try to get that song out of your head for the next few hours ...)
Back when MAFL was an infant I based Funds on statistical models that predicted either which team would win or by how much they'd win, the rationale being that models tuned to predict game outcomes might be good at identifying teams to wager on. The in-market performance of these Funds lends highly qualified support to this hypothesis.
More recently - I think it was only last year - I realised that I could use Formulize (now Eureqa) with a Custom Metric to create models that explicitly maximised a probability score on fitted games, which tends to make them well-calibrated. From earlier analyses, we know that predictors with high probability scores relative to the bookmaker's score on those same games tend to produce higher modelled wagering ROI, so this seemed like a good idea too.
Both of these approaches, though, are indirect ways of modelling the outcomes of wagering. What if, instead of modelling how games finished, I found a way to model the profit opportunity that these results produced?
Crafting The Custom Metric
Consider first the modelling of wagering outcomes for Home teams.
To do this, we create for each game a variable that represents the return that would have accrued to a unit wager on the Home team in that game. Call this variable Home_Return. It will take on a value equal to the TAB price less 1 when the Home team wins, half the TAB price less 1 when the Home team draws, and -1, representing the loss of the unit stake, when the Home team loses.
Then we use a Custom Metric to coax Formulize to find optimal functions for the recommended wager on the Home team, expressed as a proportion between 0 and 1, which we can think of as the fraction of a unit we'll wager on the Home team in that game. The Metric we use is of the following form:
1000 - g[f(Variables to Use)]*Home_Return = 0
(I'm not entirely sure why I need that constant up front in the formulation, but without it Formulize was having none of it. Mathematically, the minimisation problem is the same with it in or out.)
For the function g in this Metric we need to pick a "squashing function", something that will keep the result of g(f()) in the range (0,1) as required, and for Variables to Use I've turned to the usual suspects: Home Team MARS Rating, Away Team MARS Rating, Interstate Status, Home Team Price, Away Team Price, and Implied Home Team Probability (which is derived from Home Team Price and Away Team Price, but which, by externally calculating and explicitly including it, prevents Formulize from levying a complexity penalty on any model that might luck upon it and decide to include it should it prove predictive).
It's Formulize's job to find the best function f() and the best way to express the variables within that function.
A concrete version of this Custom Metric is:
1000 - logistic(f(Home Team MARS Rating, Away Team MARS Rating, Interstate Status, Home Team Price, Away Team Price, Implied Home Team Probability)*Home_Return = 0
Given this Metric, Formulize will attempt to minimise the expression on the lefthand side of the equals sign, and that's equivalent to maximising logistic(f())*Home_Return, which is the return that would have been achieved by wagering logistic(f()) units on the Home team in each of the games in the sample (where f() is the same function for each game, and is evaluated for each game based on the values of the variables for that game). Formulize is, therefore, finding the most profitable ways to express the wager on the Home Team as a function of the input variables given to it.
Other candidates to for the role that the logistic function is playing in this formulation are:
- the gauss function, which is exp(-x^2)
- a rescaled version of the hyperbolic tan function, (tanh + 1)/2
- Formulize's undocumented constrain function, which lets you constrain a function to a specified range such as (0,1)
Separating Good Fit from Good Fortune
For the modelling performed for this blog I've reverted to the period for which I'm most confident about the TAB market prices I have, which is all games from the start of season 2006 to the end of season 2011. My goal then is to use Formulize to create a model that would have been profitable wagering on teams across that period. I'll be fitting two models, one exclusively for wagering on Home teams and the other exclusively for wagering on Away teams.
Now with non-linear models such as those that Formulize creates it's essential to guard against overfitting. I've done this in three ways:
- By using random 0/1 weights for each game, which effectively splits the game data into a model building and a holdout set. I put roughly one half of the games in each set. (The technique I used to do this was to create a random 0/1 variable called Weight and then tell Formulize to use this variable as the caseweight. In this way Formulize ignores the contribution of games with zero weight in the overall Fitness calculation)
- By selecting the Custom Mode and selecting a 50/50 split, which forces Formulize to use only one-half of the model building data (ie about a quarter of the entire data set) for constructing the model, keeping the other half of the model building data for it to do its own validation
- By considering only those models suggested by Formulize that are of low to moderate complexity - usually those with a Complexity Score below 10
I was also concerned that the models might focus too much of their attention trying to profit from occasional longshot winners, making their modelled profitability highly variable and therefore highly suspect. Better a model that churns out small profits by wagering small amounts on many games than one that makes huge (modelled and probably not replicable) profits by wagering large amounts on just a few games.
To address this concern I removed from the data those games in which the Home team or the Away team was priced above $5. This also served to remove shorter-priced favourites from the sample and left just over 900 games available for modelling.
As a final point of technical interest for Formulize users the Home and Away MARS Ratings were normalised by subtracting their respective means across the sample (about 999 and 1,002) and dividing the result by 1,000. This does seem to have a meaningful effect on the models produced.
Home Team Results
Let's look firstly at the results for modelling the returns to Home team wagering when using a logistic as the squashing function.

The first model on the left advises that we bet on the Home team in each game an amount equal to the logistic of 0.52 divided by the Away team's normalised Rating less 47. If you work through the maths of this function with realistic values for Price and Ratings it amounts to the rule:
- If the Away team's normalised Rating is positive but less than about 0.01 bet 1 unit, otherwise bet 0 (actually the bet size tapers from 1 to 0 for Away team normalised Ratings between about +0.010 and +0.012)
A normalised Away team Rating of 0 is roughly equivalent to a raw Rating of 1,002 and a normalised Rating of +0.01 is roughly equivalent to a raw Rating of 1,012. In essence, this model posits that there's a Goldilocks zone of Away team Ratings in which the TAB Bookmaker more often misprices the Home team.
This model, which wagers in a little over one-quarter of the holdout games, produces a small positive ROI overall for those games, but turns a profit in only 3 of the 6 seasons on the holdout games.
Our next model is very similar, but has a slightly shifted Goldilocks zone and, as a consequence, fractionally higher ROIs in each season and overall.
The third model has a Goldilocks zone for the Away team Rating that's defined not by constants but instead by a function of the Away team's market price. It advises that we bet an amount equal to the logistic of the ratio of the Away team's Price and its normalised Rating less 145.2, which amounts to the following rule:
- If Away Price / 145.2 > Normalised Away team Rating and the Normalised Away team Rating is positive, bet 1 unit; otherwise bet 0
So, curiously, this model is suggesting that it's when the Away Price appears to be "too high" given the strength of the Away team, and the Away team is Rated over 1,002, that the Home team is likely to represent value.
Curious or not, the model produces an ROI on the holdout games of just under 5%, the highest of the three models we've so far considered, and it does this while betting on about 30% of holdout games and winning almost 60% of those wagers. Most impressively, this rule would have returned a positive ROI on the holdout games in every one of the past six seasons, including the treacherous 2011 season.
Lastly, the fourth model has what turns out to be the simplest Goldilocks zone: whenever the Away team's normalised Rating is positive, bet the Home team 1 unit. It produces the highest overall ROI at 10% and wagers in by far the largest proportion of games at 59%. But, it wins the smallest proportion of its wagers and would have lost heavily in 2011.
All four of these models, in slightly different ways, are picking up on the apparent mispricing of games involving Away teams of above-average ability as signalled by a MARS Rating over 1,002.
Next, consider models squashed by the gauss function.

The model on the left is the first one we've reviewed so far that regularly recommends wagers that aren't 1 unit or 0 units. It too effectively has a Goldilocks zone for the Away team Rating, which starts at a Rating of about 1,004 where it recommends small wagers on the Home team, rises to a peak at around 1,010 where it recommends the maximum 1 unit wager, then tapers off until around 1,017 where it again recommends very small wagers.
It produces an ROI of almost 7% on the 26% of holdout games on which it wagers, winning 54% of them, and it produces a profit in 4 of the 6 seasons with 2006 and 2008 the exceptions.
Model 2 is a subtle variant of the first model that wagers more when the Away team is Rated between about 1,006 and 1,010 and less otherwise. It too effectively starts wagering when the Away team is Rated over 1,004 and it stops when the Away team is Rated over about 1,018. These apparently small changes lift the ROI on holdout games by about 50% to almost 10%, and also lift the ROI for every season - except 2011.
The final gauss-based model is one that I felt compelled to include solely for the apparent beauty of its functional form. It recommends a wager on the Home team of an amount equal to the gaussian of the exponential of the ratio of the Ratings of the Home and the Away teams - that's exp(-(exp(Home Rating / Away Rating)^2).
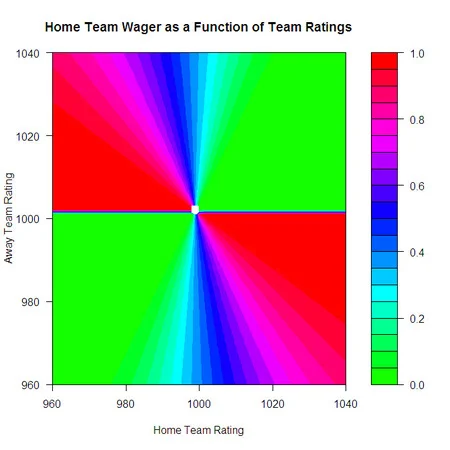
At first this model made sense to me because I thought the ratio of the Ratings and the recommended wager would grow as the Home team Rating grew, but then I realised that we're dealing with normalised Ratings here, and that the ratio of the normalised Ratings can be positive, negative, or even undefined. This makes for a very complicated and strange relationship between the raw team Ratings and the recommended wager on the Home team, as depicted in the riotously coloured chart at left.
As you can see, the games where this model thinks the most opportunity lies are those where the Home team is below average and the Away team is above average, or where the opposite is true.
Regardless of what we make of its wagering strategy, the model ekes out about an 8% ROI on the holdout games and is profitable in every season except 2011.
I'll finish the discussion of Home team wagering models by showing just three more that Formulize spat out when other squashing functions were deployed.

On the left is one of the models that was generated when I used the constrain() operator. It amounts to the rule: wager 1 unit on the Home team when it's Rated less than about 996 and its opponent is Rated 1,002 or more. This rule produces the highest ROI of all the models shown here, almost 20% on holdout games, but wagers on only 19% of these games, winnng 43% of them. It's profitable in every season, especially in 2009 and 2010, but it loses heavily in 2011.
In the middle is perhaps the most conventional model so far, and uses the hyperbolic tan function for squashing. It starts wagering on Home teams that are Rated around 1,013, with just very small bets at first, and then increases the size of its wager as the Home team Rating grows, reaching virtually the full 1 unit on teams Rated around 1,035. It returns a small ROI on the relatively few holdout games on which it wagers and generates single-digit positive ROIs in all but the first and last seasons, in which it instead generates single-digit losses.
The final model also uses tanh but is based on the Rating of the Away team and moves from a recommended wager of around zero for an Away team Rating of around 1,002 to a recommended wager of the full unit for an Away team Rating of 1,002.5. This behaviour essentially makes it a model that wagers nothing or the full 1 unit. Its ROI on holdout games is 10% and it wagers on over one half of these games, winning about one half of those. It throws a profit in every season but 2011.
Away Team Results
Following exactly the same approach as for building Home team wagering models but using instead the Custom Metric 1000 - g[f(Variables to Use)]*Away_Return = 0 yielded the following models for various squashing functions g.

I'll leave the details of these models for the reader to walk through, with the more detailed exposition for the Home team models zbove as a guide, but will note the following:
- It's interesting to see how different squashing functions manage to produce identical or near-identical models - look at the first model using the Constrain function and the model using the logistic, then look at the second model using the Constrain function and the second model using the gaussian.
- None of the models produces a profit on all holdout games, and none make a profit in any of the seasons between and including 2006 and 2009. Just two models - effectively the same model - produce a profit in 2010 and, irony of ironies, all are profitable in 2011.
As I've claimed in other blogs, something about 2011 was just different - that know that this must be true when models wagering only on Away teams make profits.
