An Empirical Review of the Favourite In-Running Model
/In the previous blog we reviewed a series of binary logits that modelled a favourite's probability of victory given its pre-game bookmaker-assessed head-to-head probability and its lead at the end of a particular quarter. There I provided just a single indication of the quality of those models: the accuracy with which they correctly predicted the final result of the game.
That's a crude and very broad measure of performance. In this blog we'll take a closer look at the empirical fits to investigate the models' performance in games with different leads and different victory probabilities for the favourite.
To start with, here's the comparison between the number of games that favourites have actually won and those that the model suggests they should have won, for different values of the favourite's trail or lead at quarter-time.
(all images in this blog can be clicked to access larger versions.)
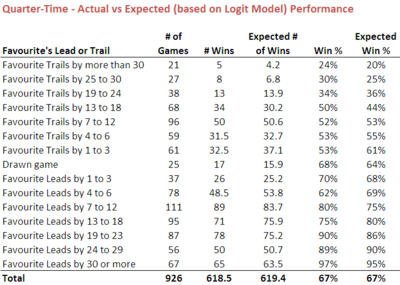
Often, a model will struggle at the extremes, so here I'm especially interested in seeing how it performs for very large favourite leads or trails.
Consider firstly those games where the favourite trails at quarter-time by more than 30 points - the first row of the table. That's been the case in 21 contests over the period 2006-2010 and, in those contests, the favourite has prevailed on only 5 occasions, which is just 0.8 games more than the model would predict. (The model's prediction for the number of games that the favourites would, in aggregate, be expected to win is determined by summing the probabilities it produces for the individual games.)
Across the entire range of favourite trails and leads, the empirical fit for this first model is very good. In terms of winning percentage, the largest difference is only 8% - which is under 5 games - for favourites that trailed by 1 to 3 points at quarter-time. They've won slightly less often than the model predicts.
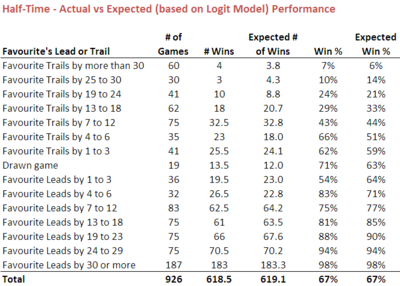
Next, consider the model that's appropriate for modelling the half-time trail or lead of the favourite.
Again let's start by considering the extreme event of the favourite trailing by more than 5 goals at the mainbreak. There've been 60 such games across the 5 year period we're considering and in only 4 of them has the favourite bounced back to overcome the deficit. That's just 0.2 games different from what we'd expect based on the binary logit.
Across the range of trails and leads the fit is again highly acceptable. There are a few larger discrepancies, however, most notably for favourites trailing by between 4 and 6 points, which have won 66% of the time when the model suggests they might have been expected to win only 51% of the time. The difference is almost exactly 5 games out of the 35 in which this scenario has applied.
Favourites have also done better than expected when they've led by 4 to 6 points at half time, winning 83% of the time when the models projects only a 71% win rate, but they've also done worse when they've been only 1 to 3 points ahead, winning 54% of such contests compared to an expectation of 64%.

Lastly, we need to review the binary logit applicable to the scores at three-quarter time.
One of the implications of this model that I highlighted in the earlier blog was how relatively unlikely it was, the model suggested, that a favourite trailing significantly at three-quarter time would eventually prevail.
The empirical data as presented here supports this contention. Of the 81 favourites that have trailed by more than 5 goals at three-quarter time, only 1 has gone on to win. That's almost exactly the number of wins that the model projects.
Even a trail of just 13 to 18 points has proved too much for over 75% of the 49 favourites that have found themselves in this position at the final change. Again this is almost exactly in line with the model's prediction.
The one notable discrepancy between actual and expected performance for this model is for favourites leading by 1 to 3 points at three-quarter time of which there have been only 17, which makes the actual and estimated performances statistically highly variable. Such favourites have won 94% of the time, some 31% points more often than the model predicts, a difference of just over 5 games.
So, viewed from the perspective of the favourite's trail or lead at quarter time, half time, or three-quarter time, it's fair to say that the models fit the empirical data well.
Next let's bring in the other input to the models, the favourite's pre-game probability as assessed by the bookmaker. Since we've only just over 900 games in our sample and we're introducing another variable by which we'll be sub-categorising games we need to reduce the number of ranges of trails and leads that we consider in order to ensure we've a statistically meaningful sample of games in each cell. To achieve this end, I've collapsed the three most extreme trail categories and the three most extreme lead categories.
(By way of context for the favourite probabilities, a 50% rated favourite will be priced around $1.90, a 60% favourite around $1.55, a 70% favourite around $1.33, and an 80% favourite around $1.20.)

Firstly, let's look at the quarter time model again.
The first row of numbers in this table summarises the actual and expected outcome of the 34 games in which the favourite has trailed by more than 3 goals at the final change and was rated somewhere between a 50 and 60% chance of victory pre-game. It shows that 8 of these teams have won against an expectation of just 6.7 victories.
One of the prime motivations for writing this blog was to investigate how well the models fit the empirical data for short-priced favourites that trailed - specifically, do they win as infrequently as the models suggest.
In this table there is some weak evidence that they win slightly more often than expected when they trail at quarter time. If you sum all the rows for 80%+ favourites that trailed at quarter time you find that they've won 34 games against an expectation of 30.4 games. That's mildly suggestive but a long way short of definitive.
Certainly for favourites rated 70<80% chances there's no evidence at all of the model underestimating their win propensity. In fact, if anything, there's evidence for the contrary since these favourites have won over 8 games fewer than expected across the 78 games in which they've trailed at quarter time.
Another interesting fact that can be gleaned from this table is the mild underperformance of favourites rated 60 to 70% chances that led at quarter time. These favourites have won almost 10 games fewer than expected across the 155 games in which they've led.
The final row provides a sobering if unsurprising reminder of the futility in hoping for a come-from-behind victory by a heavy underdog that trails by more than 3 goals at quarter time. None of the 55 teams that have trailed by 19 points or more at quarter time when facing a favourite rated 80%+ chances have gone on to win.
More generally, a lead of more than a goal has been insurmountable for the underdog in all but three games where the favourite has been an 80%+ chance pre-game. (One more of these 91 games has also resulted in a draw.)
In summary, looking across all trails and leads and all classes of favourite, from narrow to strong, again we find solid empirical support for the binary logit model.
Next let's look at the same view but for the favourite's trail or lead at the main break.

Now we find no evidence at all for any underestimation of the chances of the trailing short-priced favourite, although we've not a lot of data to go on since short-priced favourites so rarely trail at half time.
Across the 23 games that we do have where a team rated an 80%+ chance pre-game has trailed at half time, on 13 occasions the favourite has prevailed, which is just 0.4 games more than we'd expect based on the model.
There's also no evidence of any under or overestimation for favourites rated 70 to 80% chances. They've trailed at half time in 72 contests, winning 30 of them against an expectation of 30.7 wins.
The mild underperformance of front-running favourites rated 60 to 70% chances is apparent in this half-time data too. Such favourites have led in 147 games, winning 121 of them, almost 8 fewer than the model's expectations project.
In the half-time data we also observe the phenomenon that leading favourites are winning favourites.
Only four of the 126 favourites rated 80%+ that have led by any margin at half time have gone on to lose and just one more has walked away with a draw.
To that statistic you can add 7 from 7 more such favourites that have been tied at the half, or trailed by a goal or less, that have also gone on to be victorious.
(For those of you who might be curious about that one loss of a favourite rated 80%+ and leading by 19 or more at half time, it occurred in Round 7 of 2008 when Port Adelaide, priced pre-game at $1.12, led the Blues 44-21 at half time before going on to lose 63-75.)
A final observation I'll make on this table is the surprisingly high rate of projected and actual winning associated with favourites of any price range that lead by more than 3 goals at half time. At a minimum, they're projected to win at over over 90% and in reality they do exactly that.
To reiterate: a lead's a very valuable thing in football.
If you've got this far, you'll know where this is going next: to the three-quarter time data.

Trailing favourites rated 80%+ chances are now about as hard to find as a dog at a fireworks display. Only 22 examples exist for the period 2006 to 2010 and they've won only 9 of the relevant contests, exactly the number than we'd expect using the model's projections.
Favourites rated 70 to 80% chances that trail at three-quarter time are not quite as rare. We've 61 examples of these and they've won 18 games against an expectation of 16.1 games.
As we move to less short-priced yet still trailing favourites the empirical (and expected) win rate tails off appreciably. Of the 104 favourites rated 60 to 70% chances pre-game, only 14.5 of them that trailed by any margin at three-quarter time went on to win (about 8 games fewer than expected), and of the 140 favourites rated 50 to 60% chances pre-game, only 27 of them went to win (about 6 games more than expected). Those are just 14% and 19% winning rates, respectively.
A favourite rated an 80%+ chance that leads at three-quarter time is a highly bankable commodity. Of the 127 teams that fit that description, only one of them has lost and one drawn over the 5 seasons. This extremely high rate of success is only 2 games higher than the model predicts.
(The solo loss was in the Port Adelaide v Carlton clash referenced above, where Port, which has led by 23 points at half time, had extended the lead to 30 points by the final change only to score 3 points to Carlton's 45 in the final term to lose by 2 clear goals.)
The overall fit for other front-running favourites is equally good. Teams rated 70 to 80% chances that led at three-quarter time have won 141.5 of 151 clashes, just 1 fewer than expected; teams rated 60 to 70% chances have won 148.5 of 163, only about half a game less than expected; and teams rated 50 to 60% chances have won 126 of 145 games, about 1 game less than expected.
Taken as a whole, the evidence seems to suggest that the binary logits fit the empirical data well, in total, for any sized trail or lead, and for favourites of any price range.
