Projecting the Favourite's Final Margin
/In a couple of earlier blogs I created binary logit models to predict the probability that the favourite would win given a specified lead at a quarter break and the bookmaker's assessed pre-game probability for the favourite. These models allow you to determine what a fair in-running price would be for the favourite.
You might instead want to know what the favourite's projected victory margin is given the same input data, so in this blog I'll be providing some simple linear regressions that provide this information.
Here we're fitting equations of the form:
Favourite's Final Margin = Constant + a x Favourite's Lead at Quarter X + b x (Favourite's Pre-Game Probability - 50%)
Again I'll fit three equations, one each for X = 1, 2 and 3, providing a separate model to use depending on whether you have the favourite's quarter-time, half-time or three-quarter time margin. The data that I'll use for this purpose is once more that for all games from the 2006 to 2010 seasons.
Here are the models:

The first column gives the coefficients of the model fitted to favourites' quarter time leads (which can of course be negative if the favourite trails). It tells us that, for example, an equal favourite - that is, one with a probability of 50% - will be expected to increase its lead by 14% relative to what it was at quarter time, less about 3 points. So, if such a favourite leads by 30 points at quarter time it is expected to eventually win by about 31 points (ie 30 x 1.14 - 2.84).
Columns two and three provide the coefficients for use with the favourite's half-time and three-quarter time leads.
The R-squared figures tell us that, not surprisingly, we can far more confidently predict the favourite's final margin using the three-quarter time score (for which the relevant model's r-squared is 81%, signifying that the model explains this proportion of the variability in the favourite's final margin) than we can using the quarter-time or half-time score (where the respective r-squareds are 36% and 60%).
As we did for the binary logits in the earlier blog, we can here estimate the relative importance of the favourite's pre-game probability and its lead in explaining the eventual margin. When we do this we find a rapid attenuation in the contribution of the bookmaker's pre-game probability assessment, from just under 30% for the quarter-time position to a mere 8% for the three-quarter time position, which are proportions remarkably similar to those we calculated using the binary logits. Again we're forced to conclude that the best information we have about the outcome of a game while it's in progress is the current score and the time remaining. Pre-game favouritism counts for little once the contest has commenced its narrative.
To help you get a feel for these models I've prepared the following set of tables, which project the eventual margin for favourites of various pre-game probabilities given a specified lead at a particular quarter break.

So, for example, a favourite rated a 60% chance pre-game (refer to the upper right block of numbers) that leads by 12 points at quarter-time is expected to go on to win by just under 20 points.
One of the aspects of the models that these tables brings out is how generally small is the projected increase in a favourite's lead, even if that favourite is a firm one.
For example, a favourite rated an 80% pre-game chance that leads by 30 points at the first change is only projected to eventually win by 58 points, not even doubling the lead it had already established just 25% of the way through the contest.
A similar favourite that had established that same 30-point lead, but done so at three-quarter time, is expected to add just over 8 points to that lead in the remaining quarter.
This characteristic of the models aligns with my anecdotal experience, gleaned from too many years of watching raging favourites start well only to fail to go on to cover the spread.
On the topic of covering the spread, we can also use these regression models to answer the question: what is the minimum lead that a favourite must have at a quarter break in order for its projected final margin to exceed the start it is giving?
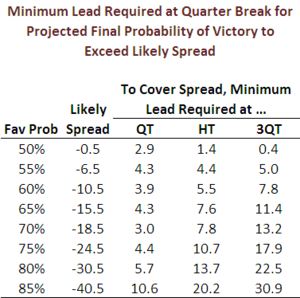
The answers to this question appear in the table at right, which shows, for example that a favourite rated a 70% pre-game chance, which will most likely be offering its opponent 18.5 points start, needs to lead by about 8 points at half-time in order that its projected final margin exceeds 18.5 points.
Interestingly, it would seem that the starts that favourites are required to offer are such that, roughly speaking, one half of the spread needs to be covered at half time and three-quarters at three-quarter time if the favourite is to be expected to cover the spread.
That's a useful heuristic to call upon if you've placed a line bet and are wondering if the team you've wagered on is ahead or behind where it needs to be at a given point in the match.
I'll finish by demonstrating the comparability of the current set of regression models with the binary logits created for the earlier blog by using the binary logit models to find the lead required to make the favourite's victory probability equal to 50% and by using the linear regressions to calculate the lead required to make the favourite's projected final margin equal to 0. Ideally, we'd expect these two sets of numbers to be similar.
As the following table shows, this is indeed the case.

