MAFL 2013 : Team Dashboard for Round 9
/This week I'll be highlighting significant differences between the teams' competition ladder positions and their Scoring statistics:
- Carlton are 8th on the ladder, but 1st on Opponent Conversion and 16th on Own Conversion
- Essendon are 3rd on the ladder, but 10th on Own Conversion
- Fremantle are 4th on the ladder, but 12th on Own Scoring Shots and 1st on Opponent Scoring Shots
- Geelong are 2nd on the ladder, but 13th on Opponent Conversion
- GWS are 18th on the ladder, but 7th on Own Conversion
- Hawthorn are 1st on the ladder, but 11th on Opponent Conversion
- The Kangaroos are 13th on the ladder, but 6th on Own Scoring Shots, Own and Opponent Conversion
- Melbourne are 17th on the ladder, but 5th on Own Conversion
- Port Adelaide are 9th on the ladder, but 15th on Opponent Conversion
- St Kilda are 15th on the ladder, but 3rd on Opponent Conversion
- Sydney are 5th on the ladder, but 13th on Own Scoring Shots and 12th on Opponent Conversion
- West Coast are 6th on the ladder, but 1st on Own Scoring Shots and 17th on Opponent Conversion
- The Western Bulldogs are 16th on the ladder, but 4th on Own Conversion
One feature from this list is the apparent lack of importance of Opponent Conversion rates - teams high up on the ladder seem to have poor Opponent Conversion statistics and teams lower on the ladder seem to have better Opponent Conversion statistics. Indeed, the rank correlation between ladder position and ranking based on Opponent Conversion is just +0.18.
What's mattered instead this season has been how many scoring shots opponents a team has allowed its opponents. The correlation between the ranking on that metric and ladder position now stands at +0.86.
MAFL 2013 : Team Dashboard for Round 8
/This week I'll draw your attention to the right-hand portion of the Scoring Shot Data, which provides information about each team's actual performance in terms of competition points earned, relative to what might be expected based on the team's scoring shot metrics and the win production function I derived back in this blog from 2011. (Note that I'm using the first equation from that blog).
According to this analysis, the teams that have achieved significantly more wins than their scoring shot data would predict are:
- Geelong, who've won 88% of their games when their scoring statistics would predict a 67% record,
- Collingwood, who've won 63% of their games when their scoring statistics would predict a 46% record, and
- The Brisbane Lions, who've won 38% of their games when their scoring statistics would predict a 24% record
Confirmatory evidence for the relative good fortune of these three teams comes from the fact that both the Cats and the Pies have recorded 3 victories by less than 3 goals, and that the Lions have recorded 2 victories by less than 2 goals.
Conversely, the teams that have achieved significantly fewer wins than their scoring shot data would predict are:
- Adelaide, who've won 50% of their games when their scoring statistics would predict a 72% record,
- The Roos, who've won 38% of their games when their scoring statistics would predict a 59% record, and
- St Kilda, who've won 25% of their games when their scoring statistics would predict a 40% record
Again we can find support for these assessments in relevant game margins: Adelaide have lost 2 games by less than 2 goals, while the Roos have lost 4 games and the Saints 3 games by less than 3 goals.
MAFL 2013 : Team Dashboard for Round 6
/This week I'm going to discuss some of the rank correlations between various of the metrics on the Team Dashboard and teams' competition ladder positions.
Firstly, looking at the metrics in the Scoring Shot Data section, we find the following correlations with ladder position (the equivalent correlations for the Team Dashboard at the end of the 2012 home-and-away season are in brackets):
- Correlation with Own Scoring Shots per Game : +0.79 (+0.88)
- Correlation with Opponent Scoring Shots per Game : +0.78 (+0.77)
- Correlation with Difference in Scoring Shots per Game : +0.95 (+0.89)
- Correlation with Own Conversion Rate : +0.27 (+0.70)
- Correlation with Opponent Conversion Rate : +0.23 (+0.29)
- Correlation with Difference in Conversion Rate : +0.39 (+0.69)
The only substantial differences in these correlations from the equivalent figures for last season are those for Own Conversion Rate and the Difference in Conversion Rate. This season then, so far, it's been more important for teams to create lots of scoring shots and prevent their opponents from doing the same than it has been to convert those opportunities or prevent their opponents from doing so. Put another way, it's been a season for quantity of opportunities rather than quality.
Finally, consider the correlations between quarter-by-quarter performance rankings and competition ladder position:
- Q1 performance : +0.39 (+0.79)
- Q2 performance : +0.72 (+0.76)
- Q3 performance : +0.84 (+0.62)
- Q4 performance : +0.65 (+0.70)
The obvious conclusion from this is that 1st terms have been far less important and 3rd terms somewhat more important so far this season than they were in the home-and-away season last year. I'll have more to say about this in a blog I'm planning to write this week.
MAFL 2013 : Team Dashboard for Round 4
/A handful of things that caught my eye as I reviewed this week's Team Dashboard:
- The first 11 teams on the ladder have percentages over 100. When was the last time that was true, I wonder
- Adelaide, in 8th, have scored only about 10 points per game more than GWS, in 18th. Of course they've conceded over 18 points per game fewer as well, which is what explains their more-elevated status
- Geelong's combined victory margins across its four wins is just 48 points
- Port Adelaide have registered almost 12 scoring shots per game more than their opponents. Melbourne have conceded almost 19 more per game than their opponents
- Geelong have the best record of any team in the 3rd quarter, but are 14th and 15th-best in 1st and 2nd terms
- Hawthorn, the Roos and Richmond all have the opposite pattern, faring relatively poorly in 3rd terms and much better in the rest of the game
- Both the Gold Coast in 2nd terms and Melbourne in 3rd terms score only 18 points for every 100 points scored by their opponents in these respective quarters
MAFL 2013 : Team Dashboard for Round 3
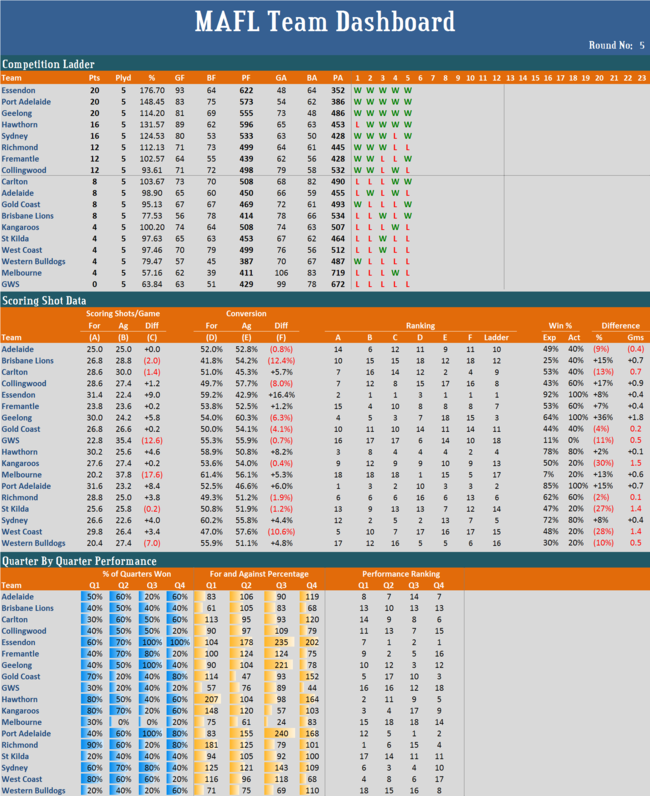
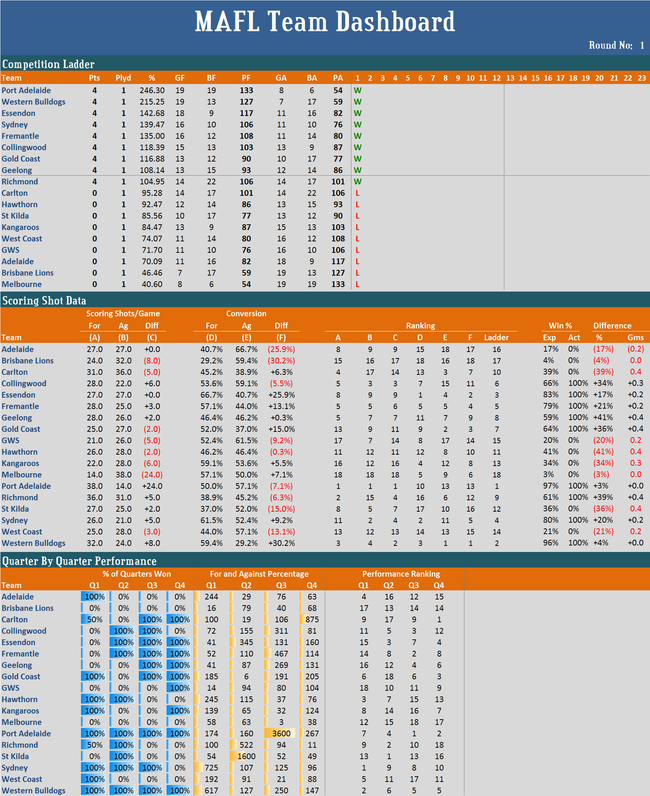
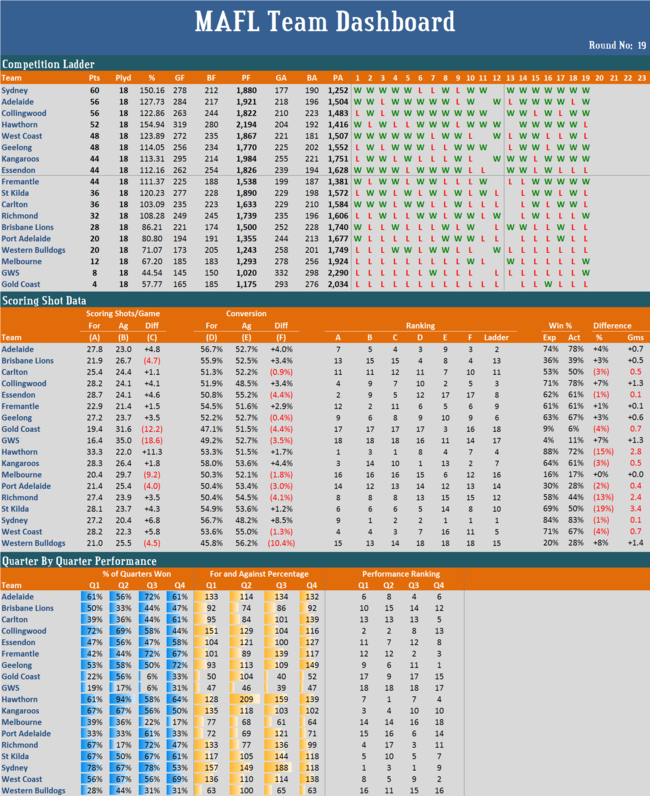
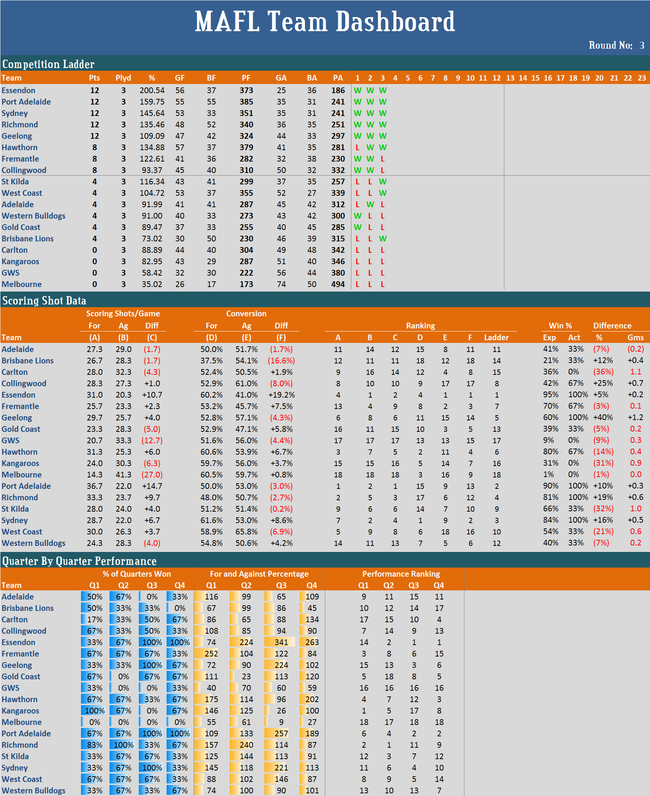
/Five teams remain equal on competition points, undefeated and at the head of the competition ladder, but their percentages range from the Dons' 200 to the Cats' 109.
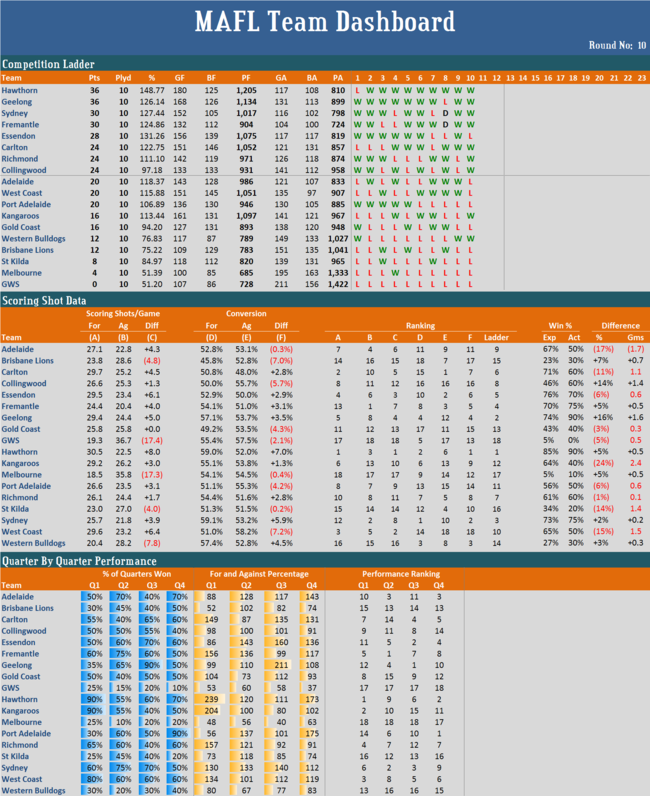
The Roos wish games didn't have a third quarter, Fremantle wishes they didn't have a fourth, the Dons and Port would be happy if games only had third and fourth quarters, while Melbourne wishes games didn't have any quarters at all.
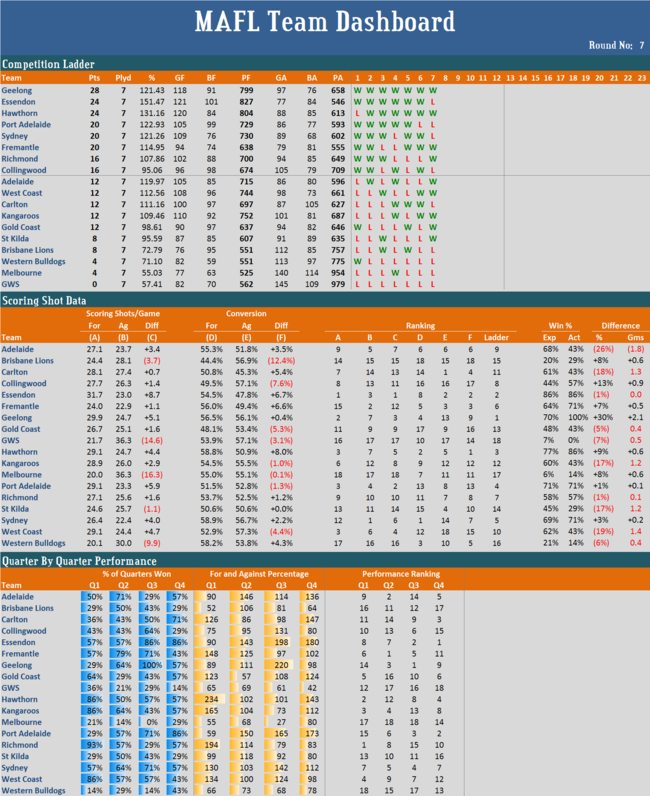
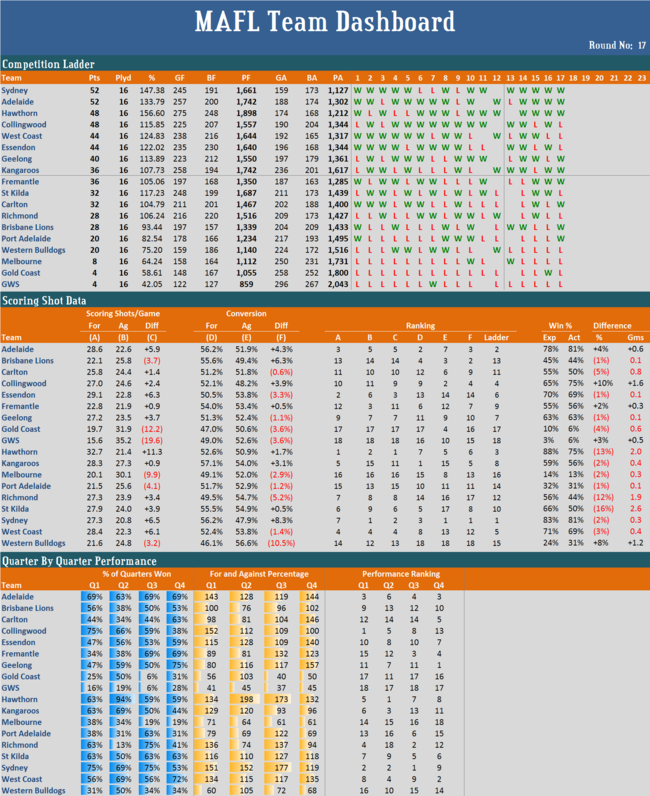
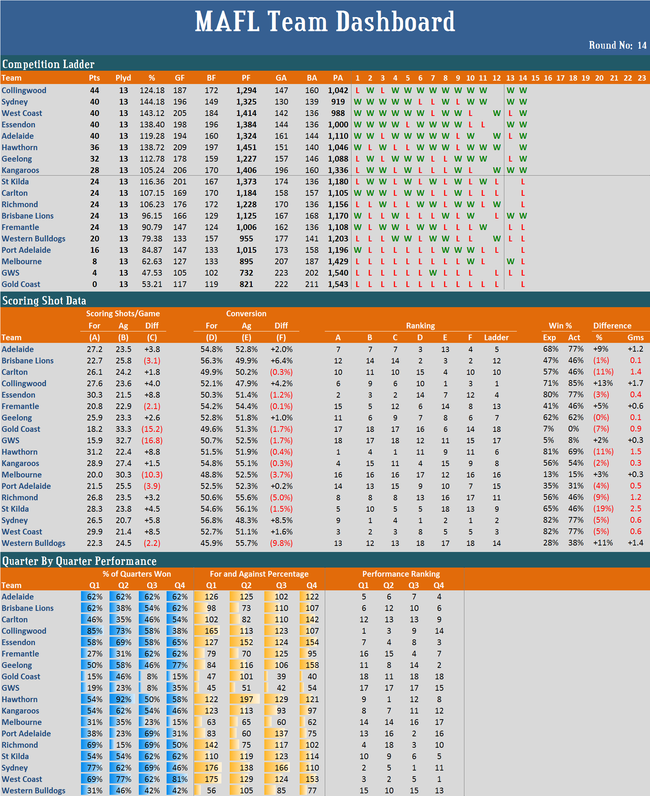
Whilst it's only early days in the competition, the Lions' coaching staff must be a bit concerned with their team's conversion rate, which currently sits at just 37.5% (30 from 80). The Lions have been generating about 27 scoring shots per game - which while it isn't top-drawer, is acceptable - but their appalling conversion rate has seen them average just 10 goals a game. That makes it hard to win.
Fremantle makes for an interesting comparison. They've generated one fewer scoring shot per game, on average, but their conversion rate of over 53% has allowed them to average over 14 goals per game, 4 more than the Lions.
MAFL 2013 : Team Dashboard for Round 2
/After just two rounds there's not a lot to comment on in the latest Team Dashboard other than, perhaps, to note that Melbourne are now the only team not to have won a quarter in either of their games and that they have a percentage of 8 in third terms and 14 in fourth terms; that the Cats have lost all four quarters from the first half of their two games and won all four quarters from the second half; and that Essendon, Port Adelaide and Sydney have outscored their opponents, in aggregate, in all four quarters.
MAFL 2012 : Team Dashboard for Round 23 (Final)
/The final Team Dashboard for 2012 is below.Ladder position aside, some of the good and bad points for each team are:
- Adelaide: 2nd on own scoring shot creation but 9th in Q2s
- Brisbane Lions: 5th on own scoring shot conversion but 15th in Q2s
- Carlton: 5th on opponent scoring shot conversion but 13 in Q1s
- Collingwood: 1st on opponent scoring shot conversion but 10th on opponent scoring shot creation and 13th in Q4s
- Essendon: 7th on Q2s but 15th on own scoring shot conversion
- Fremantle: 2nd on opponent scoring shot creation but 12th on own scoring shot creation
- Geelong: 1st on Q4s but 12th on Q3s
- Gold Coast: 3rd on opponent scoring shot conversion (and 17th on a number of measures)
- GWS: 12th on opponent scoring shot conversion (and 18th on a number of measures)
- Hawthorn: (1st on a number of measures) but 9th in Q3s
- Kangaroos: 1st on own scoring shot conversion but 13th on opponent scoring shot conversion
- Melbourne: 7th on opponent scoring shot conversion but 18th in Q4s
- Port Adelaide: 6th in Q3s but 17th on opponent scoring shot conversion
- Richmond: 3rd in Q3s and 4th on own scoring shot creation, but 17th in Q2s
- St Kilda: 2nd in Q3s and 3rd on own scoring shot creation, but 11th in Q1s
- Sydney: 1st in Q1s and Q3s, but 7th on own scoring shot creation and 11th in Q4s
- West Coast: 2nd in Q4s but 15th on opponent scoring shot conversion
- Western Bulldogs: 14th in Q2s (if we're forced to list something), but 18th on own and opponent scoring shot conversion
MAFL 2012 : Team Dashboard for Round 22
/MAFL 2012 : Team Dashboard for Round 19
/The latest Team Dashboard follows.
This week I draw your attention to each team's recent winning and losing streaks:
- Sydney's now won 9 in a row
- Adelaide's won 7 of its last 9 games
- Collingwood's won 13 of its last 15 games
- Hawthorn, before losing this week, had won 9 in a row
- West Coast has won only 3 of its last 7 games
- Geelong has won 5 of its last 7 games
- The Roos have won 7 of their last 8 games
- Essendon's won only 1 of its last 5 games
- Fremantle's won 5 in a row
- St Kilda's won 3 of its last 5
- Carlton's won 3 of its last 6
- Richmond's won just 2 of its last 6
- Brisbane's won only 1 of its last 5
- Port Adelaide's won just 1 of its last 8
- The Dogs have now lost 7 in a row
- Melbourne's won only 2 of its last 7
- GWS' win snapped a 10-game losing streak
- The Gold Coast has lost its last 3 games and has won only a single game this season
MAFL 2012 : Team Dashboard for Round 16
/The latest Team Dashboard follows.
This week, let's identify for each team the MAFL Dashboard statistics that are most at odds with the team's ladder position:
- Adelaide - 2nd on the ladder but no higher than 3rd on any on the MAFL Dashboard metrics
- Brisbane Lions - 13th on the ladder but 4th on Scoring Shot Conversion and 5th on Opponent Scoring Shot Conversion (but 12th and 13th on Own and Opponent Scoring Shot Production)
- Carlton - 12th on the ladder but 8th in final terms with a 60% winning rate and a 140 Percentage
- Collingwood - 3rd on the ladder but 1st on Opponent Scoring Shot Conversion, and 1st in 1st Quarters with an 80% winning rate and a 167 Percentage
- Essendon - 6th on the ladder but 12th on Own and on Opponent Scoring Shot Conversion, and 2nd on Own Scoring Shot Production
- Fremantle - 10th on the ladder but 5th on Opponent Scoring Shot Production, 4th in 3rd quarters, and 5th in final terms
- Geelong - 7th on the ladder but 12th in 1st and 3rd terms (with a sub-50% winning rate in each) and 2nd in final terms (with a 73% winning rate and a 153 Percentage)
- Gold Coast - 17th on the ladder but 3rd in Opponent Scoring Shot Conversion
- GWS - 18th on the ladder but 13th in Opponent Scoring Shot Conversion
- Hawthorn - 4th on the ladder but 1st on Own Scoring Shot Production and 10th on Own Scoring Shot Conversion, as well as 1st on 2nd quarters and 9th on 3rd quarters
- Kangaroos - 9th on the ladder but 1st on Own Scoring Shot Conversion and 15th on Opponent Scoring Shot Conversion
- Melbourne - 16th on the ladder but 8th on Opponent Scoring Shot Conversion and 18th on final terms with a 20% winning rate and a 62 Percentage
- Port Adelaide - 15th on the ladder but 9th on Own Scoring Shot Conversion and 7th on 3rd quarters with a 60% winning rate and a 122 Percentage
- Richmond - 11th on the ladder, 7th on both Own and Opponent Scoring Shot Production, but 14th and 16th on Own and Opponent Scoring Shot Conversion. Also, 3rd on 1st terms and 2nd on 3rd terms, but 18th on 2nd terms
- St Kilda - 8th on the ladder but 3rd on Own Scoring Shot Conversion and 17th on Opponent Scoring Shot Conversion. Also, 3rd in 3rd terms and 4th in final terms, winning two-thirds of each
- Sydney - 1st on the ladder but 8th on Own Scoring Shot Production and 10th in final terms with only a 50% winning rate
- West Coast - 5th on the ladder but 10th on Opponent Scoring Shot Conversion, 8th in 3rd terms, and 1st in final terms with a 77% winning rate and a 143 Percentage
- Western Bulldogs - 14th on the ladder but 18th on Own and on Opponent Scoring Shot Conversion, as well as 17th on 1st terms with a 27% winning rate and a 57 Percentage.
MAFL 2012 : Team Dashboard for Round 15
/The latest Team Dashboard follows.
Based purely on Scoring Shots statistics and the Win Production Function I derived last year, five teams have won one or more games fewer than their statistics would suggest they "should" have, and three teams have won one or more games "extra".
Specifically,
- St Kilda has won 2.7 games fewer, Hawthorn 2.1, Carlton 1.2, Gold Coast 1.1, and Richmond 1.0 games fewer
- Collingwood has won 1.4 games more, the Dogs 1.3, and Adelaide 1.1 games more
A competition ladder based on the expected wins from the Win Production Function would have the same teams in the top 8 as we have now in the competition proper, though ordered as follows (teams' actual ladder positions are in brackets after their name): Hawthorn (5th), Sydney (1st), West Coast (2nd), Essendon (6th), Adelaide (3rd), St Kilda (8th), Collingwood (4th), Geelong (7th).
MAFL 2012 : Team Dashboard for Round 14
/The latest Team Dashboard is below.
This week I've calculated the Spearman Rank Correlations between team competition ladder positions and their rankings on the various measures in the middle and lower sections of the Dashboard. The results are, in order, from highest to lowest correlation:
- Correlation between Ladder Position and Scoring Shots Per Game Differential (ie column C in the Scoring Shot Data section) : +0.89
- Correlation between Ladder Position and Q1 Performances (ie column Q1 in the Quarter-by-Quarter Performance section) : +0.85
- Correlation between Ladder Position and Q2 Performances (ie column Q2) : +0.82
- Correlation between Ladder Position and Scoring Shots Per Game For (ie column A) : +0.82
- Correlation between Ladder Position and Scoring Shots Per Game Against (ie column B) : +0.78
- Correlation between Ladder Position and Conversion Rate Differential (ie column F) : +0.61
- Correlation between Ladder Position and Q4 Performances (ie column Q4) : +0.59
- Correlation between Ladder Position and Q3 Performances (ie column Q3) : +0.46
- Correlation between Ladder Position and Conversion Rate For (ie column D) : +0.46
- Correlation between Ladder Position and Conversion Rate Against (ie column E) : +0.39
One way of summarising these results would be to say that success this season has so far been about first half performances and about generating more scoring shots for your own team than you allow your opponents to generate. In driving up that scoring shot differential, success has been marginally more associated with generating more shots oneself than with denying opponents their scoring shots.