MAFL 2013 : Team Dashboard for Round 6
/This week I'm going to discuss some of the rank correlations between various of the metrics on the Team Dashboard and teams' competition ladder positions.
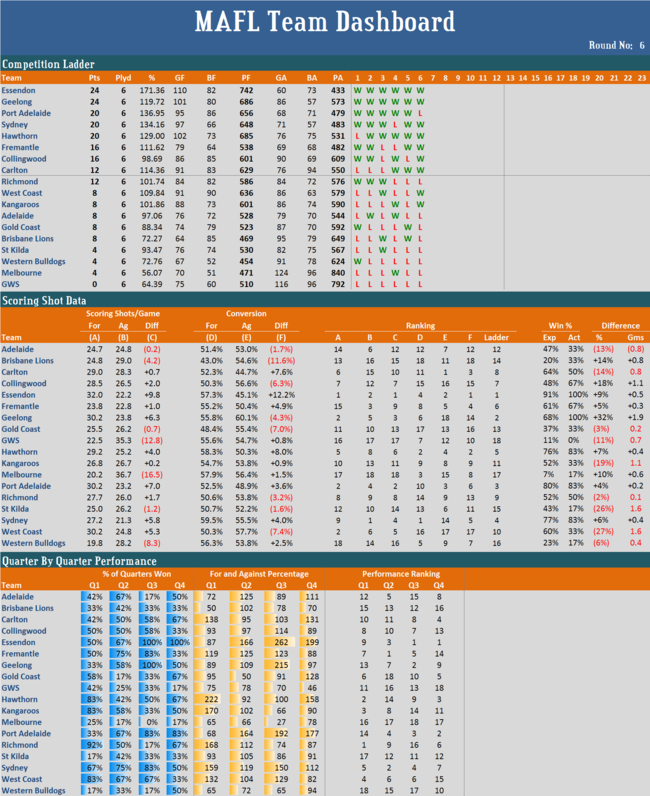
Firstly, looking at the metrics in the Scoring Shot Data section, we find the following correlations with ladder position (the equivalent correlations for the Team Dashboard at the end of the 2012 home-and-away season are in brackets):
- Correlation with Own Scoring Shots per Game : +0.79 (+0.88)
- Correlation with Opponent Scoring Shots per Game : +0.78 (+0.77)
- Correlation with Difference in Scoring Shots per Game : +0.95 (+0.89)
- Correlation with Own Conversion Rate : +0.27 (+0.70)
- Correlation with Opponent Conversion Rate : +0.23 (+0.29)
- Correlation with Difference in Conversion Rate : +0.39 (+0.69)
The only substantial differences in these correlations from the equivalent figures for last season are those for Own Conversion Rate and the Difference in Conversion Rate. This season then, so far, it's been more important for teams to create lots of scoring shots and prevent their opponents from doing the same than it has been to convert those opportunities or prevent their opponents from doing so. Put another way, it's been a season for quantity of opportunities rather than quality.
Finally, consider the correlations between quarter-by-quarter performance rankings and competition ladder position:
- Q1 performance : +0.39 (+0.79)
- Q2 performance : +0.72 (+0.76)
- Q3 performance : +0.84 (+0.62)
- Q4 performance : +0.65 (+0.70)
The obvious conclusion from this is that 1st terms have been far less important and 3rd terms somewhat more important so far this season than they were in the home-and-away season last year. I'll have more to say about this in a blog I'm planning to write this week.