The 2014 Grand Final : When the Coin Flipped

The Sydney Swans were deserved pre-game favourites on Saturday according to most pundits (but not all - congratulations to Robert and Craig for tipping the winners). At some point during the course of their record-breaking loss that favouritism was handed to the Hawks. In this blog we'll investigate when.

Read More

Grand Final History 1898-2013 : Winning Team Scoring Patterns

Only three teams in VFL/AFL history have trailed by more than three goals at Quarter Time in the Grand Final and gone on to win. The most recent was Sydney in 2012 who trailled the Hawks by 19 at the first break before rallying in the second term to kick 6.0 to 0.1, eventually going on to win by 10 points, and before that Essendon who in 1984 trailed the Hawks by 21 points at Quarter Time - and still trailed them by 23 points at Three Quarter Time - before recording a 24 point victory on the strength of a 9.6 to 2.1 points avalanche in the final term.

Read More

To Win A Grand Final You Must First Lead

History suggests that, as the higher-Rated "Home" team, Hawthorn must lead early and lead well if it is to be confident of success in Saturday's Grand Final, and not assume that its superior Rating will allow it to come back from any substantial deficit.
Read More

Lead Changes as a Measure of Game Competitiveness

The final victory margin is one measure of how close a contest was, but it can sometimes mislead when the team that's in front midway through the final term piles on a slew of late goals against a progressively more demoralised opponent, improving its percentage in so doing, but also erasing any trace of the fact that the game might have been a close-run thing throughout the first three-and-a-half or more quarters.
Read More

Characterising AFL Seasons

I can think of a number of ways that an AFL season might be characterised but for today's blog I'm going to call on a modelling approach that I used back in 2010, which is based on Brownian motion and which was inspired by a JASA paper from Hal S Stern.
Read More

Grand Final Margins Through History and a Last Look at the 2010 Home-and-Away Season

A couple of final charts before GF 2.0.

The first chart looks at the history of Grand Finals, again. Each point in the chart reflects four things about the Grand Final to which it pertains ...
Read More

Grand Final History: A Look at Ladder Positions

Across the 111 Grand Finals in VFL/AFL history - excluding the two replays - only 18 of them, or about 1-in-6, has seen the team finishing 1st on the home-and-away ladder play the team finishing 3rd.

This year, of course, will be the nineteenth.

Far more common, as you'd expect, has been a matchup between the teams from 1st and 2nd on the ladder. This pairing accounts for 56 Grand Finals, which is a smidgeon over half, and has been so frequent partly because of the benefits accorded to teams finishing in these positions by the various finals systems that have been in use, and partly no doubt because these two teams have tended to be the best two teams.

2010 - Grand Final Results by Ladder Position.png

In the 18 Grand Finals to date that have involved the teams from 1st and 3rd, the minor premier has an 11-7 record, which represents a 61% success rate. This is only slightly better than the minor premiers' record against teams coming 2nd, which is 33-23 or about 59%.

Overall, the minor premiers have missed only 13 of the Grand Finals and have won 62% of those they've been in.

By comparison, teams finishing 2nd have appeared in 68 Grand Finals (61%) and won 44% of them. In only 12 of those 68 appearances have they faced a team from lower on the ladder; their record for these games is 7-5, or 58%.

Teams from 3rd and 4th positions have each made about the same number of appearances, winning a spot about 1 year in 4. Whilst their rates of appearance are very similar, their success rates are vastly different, with teams from 3rd winning 46% of the Grand Finals they've made, and those from 4th winning only 27% of them.

That means that teams from 3rd have a better record than teams from 2nd, largely because teams from 3rd have faced teams other than the minor premier in 25% of their Grand Final appearances whereas teams from 2nd have found themselves in this situation for only 18% of their Grand Final appearances.

Ladder positions 5 and 6 have provided only 6 Grand Finalists between them, and only 2 Flags. Surprisingly, both wins have been against minor premiers - in 1998, when 5th-placed Adelaide beat North Melbourne, and in 1900 when 6th-placed Melbourne defeated Fitzroy. (Note that the finals systems have, especially in the early days of footy, been fairly complex, so not all 6ths are created equal.)

One conclusion I'd draw from the table above is that ladder position is important, but only mildly so, in predicting the winner of the Grand Final. For example, only 69 of the 111 Grand Finals, or about 62%, have been won by the team finishing higher on the ladder.

It turns out that ladder position - or, more correctly, the difference in ladder position between the two grand finalists - is also a very poor predictor of the margin in the Grand Final.

2010 - Grand Final Results by Ladder Position - Chart.png

This chart shows that there is a slight increase in the difference between the expected number of points that the higher-placed team will score relative to the lower-placed team as the gap in their respective ladder positions increases, but it's only half a goal per ladder position.

What's more, this difference explains only about half of one percentage of the variability in that margin.

Perhaps, I thought, more recent history would show a stronger link between ladder position difference and margin.

2010 - Grand Final Results by Ladder Position - Chart 2.png

Quite the contrary, it transpires. Looking just at the last 20 years, an increase in the difference of 1 ladder position has been worth only 1.7 points in increased expected margin.

Come the Grand Final, it seems, some of your pedigree follows you onto the park, but much of it wanders off for a good bark and a long lie down.

Pies v Saints: An Initial Prediction

During the week I'm sure I'll have a number of attempts at predicting the result of the Grand Final - after all, the more predictions you make about the same event, the better your chances of generating at least one that's remembered for its accuracy, long after the remainder have faded from memory.

In this brief blog the entrails I'll be contemplating come from a review of the relationship between Grand Finalists' MARS Ratings and the eventual result for each of the 10 most recent Grand Finals.

Firstly, here's the data:

2010 - Grand Finals and MARS Ratings.png

In seven of the last 10 Grand Finals the team with the higher MARS Rating has prevailed. You can glean this from the fact that the rightmost column contains only three negative values indicating that the team with the higher MARS Rating scored fewer points in the Grand Final than the team with the lower MARS Rating.

What this table also reveals is that:

  • Collingwood are the highest-rated Grand Finalist since Geelong in 2007 (and we all remember how that Grand Final turned out)
  • St Kilda are the lowest-rated Grand Finalist since Port Adelaide in 2007 (refer previous parenthetic comment)
  • Only one of the three 'upset' victories from the last decade, where upset is defined based on MARS Ratings, was associated with a higher MARS Rating differential. This was the Hawks' victory over Geelong in 2008 when the Hawks' MARS Rating was almost 29 points less than the Cats'

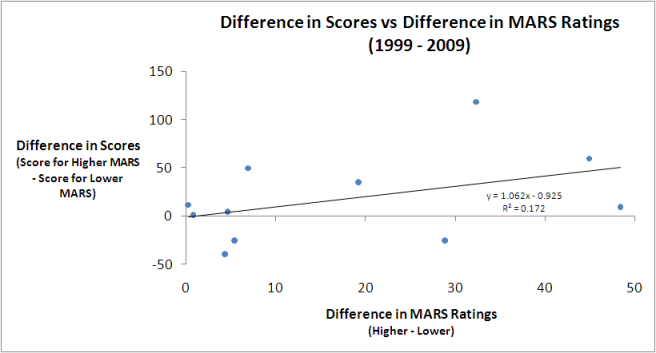
From the raw data alone it's difficult to determine if there's much of a relationship between the Grand Finalists' MARS Ratings and their eventual result. Much better to use a chart:

2010 - Grand Finals and MARS Ratings - Model.png

The dots each represent a single Grand Final and the line is the best fitting linear relationship between the difference in MARS Ratings and the eventual Grand Final score difference. As well as showing the line, I've also included the equation that describes it, which tells us that the best linear predictor of the Grand Final margin is that the team with the higher MARS Rating will win by a margin equal to about 1.06 times the difference in the teams' MARS Ratings less a bit under 1 point.

For this year's Grand Final that suggests that Collingwood will win by 1.062 x 26.1 - 0.952, which is just under 27 points. (I've included this in gray in the table above.)

One measure of the predictive power of the equation I've used here is the proportion of variability in Grand Final margins that it's explained historically. The R-squared of 0.172 tells us that this proportion is about 17%, which is comforting without being compelling.

We can also use a model fitted to the last 10 Grand Finals to create what are called confidence intervals for the final result. For example, we can say that there's a 50% chance that the result of the Grand Final will be in the range spanning a 5-point loss for the Pies to a 59-point win, which demonstrates just how difficult it is to create precise predictions when you've only 10 data points to play with.

Visualising AFL Grand Final History

I'm getting in early with the Grand Final postings.

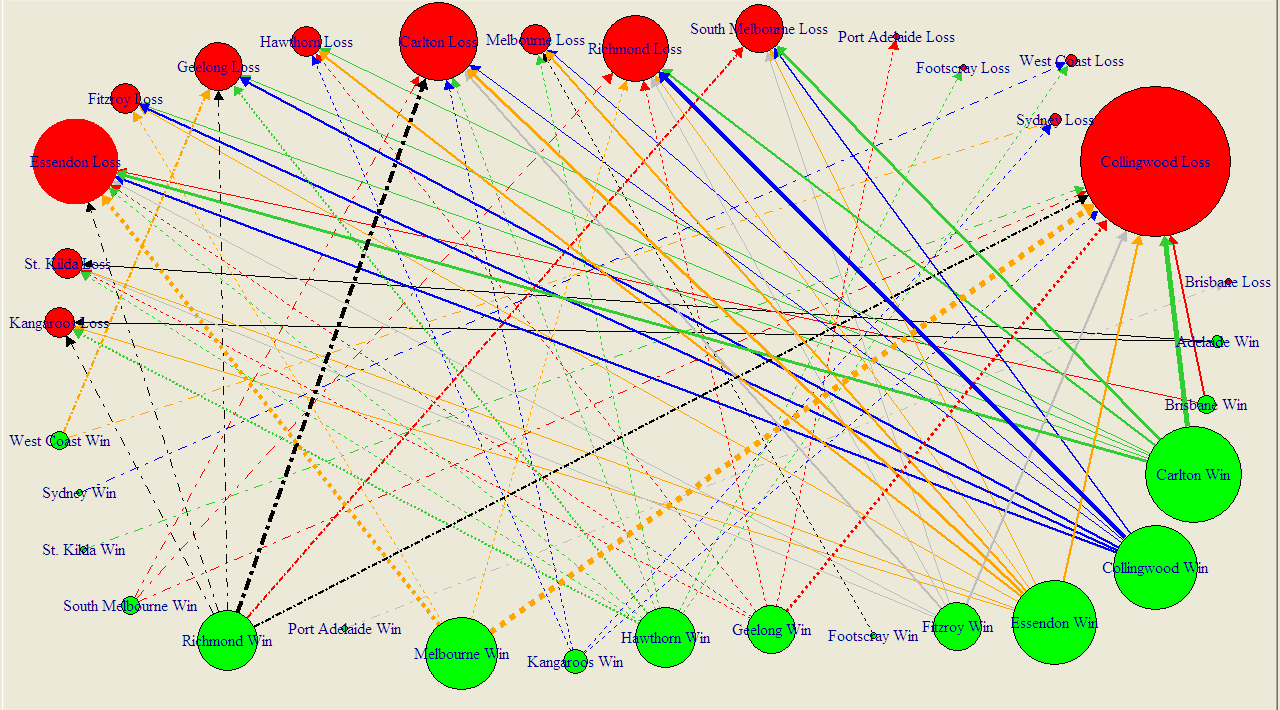
The diagram below summarises the results of all 111 Grand Finals in history, excluding the drawn Grand Finals of 1948 and 1977, and encodes information in the following ways:

  • Each circle represents a team. Teams can appear once or twice (or not at all) - as a red circle as Grand Final losers and as a green circle as Grand Final winners.
  • Circle size if proportional to frequency. So, for example, a big red circle, such as Collingwood's denotes a team that has lost a lot of Grand Finals.
  • Arrows join Grand Finalists and emanate from the winning team and terminate at the losing team. The wider the arrow, the more common the result.

No information is encoded in the fact that some lines are solid and some are dashed. I've just done that in an attempt to improve legibility. (You can get a PDF of this diagram here, which should be a little easier to read.)

2010 - Grand Final Results 1.png

I've chosen not to amalgamate the records of Fitzroy and the Lions, Sydney and South Melbourne, or Footscray and the Dogs (though this last decision, I'll admit, is harder to detect). I have though amalgamated the records of North Melbourne and the Roos since, to my mind, the difference there is one of name only.

The diagram rewards scrutiny. I'll just leave you with a few things that stood out for me:

  • Seventeen different teams have been Grand Final winners; sixteen have been Grand Final losers
  • Wins have been slightly more equitably shared around than losses: eight teams have pea-sized or larger green circles (Carlton, Collingwood, Essendon, Hawthorn, Melbourne, Richmond, Geelong and Fitzroy), six have red circles of similar magnitude (Collingwood, South Melbourne, Richmond, Carlton, Geelong and Essendon).
  • I recognise that my vegetable-based metric is inherently imprecise and dependent on where you buy your produce and whether it's fresh or frozen, but I feel that my point still stands.
  • You can almost feel the pain radiating from those red circles for the Pies, Dons and Blues. Pies fans don't even have the salve of a green circle of anything approaching compensatory magnitude.
  • Many results are once-only results, with the notable exceptions being Richmond's dominance over the Blues, the Pies' over Richmond, and the Blues over the Pies (who knew - football Grand Final results are intransitive?), as well as Melbourne's over the Dons and the Pies.

As I write this, the Saints v Dogs game has yet to be played, so we don't know who'll face Collingwood in the Grand Final.

If it turns out to be a Pies v Dogs Grand Final then we'll have nothing to go on, since these two teams have not previously met in a Grand Final, not even if we allow Footscray to stand-in for the Dogs.

A Pies v Saints Grand Final is only slightly less unprecedented. They've met once before in a Grand Final when the Saints were victorious by one point in 1966.

Grand Final Typology

Today's blog looks at the typology of AFL Grand Finals. There are, it turns out, five basic types: (1) The Coast-to-Coast Coasting victory (2) The Come-From-Behind victory (3) The Game-of-Two-Halves Victory (4) The Coast-to-Coast Blowout Victory (5) The Nervous Start Victory
Read More

Grand Finals: Points Scoring and Margins

How would you characterise the Grand Finals that you've witnessed? As low-scoring, closely fought games; as high-scoring games with regular blow-out finishes; or as something else?

First let's look at the total points scored in Grand Finals relative to the average points scored per game in the season that immediately preceded them.

GF_PPG.png

Apart from a period spanning about the first 25 years of the competition, during which Grand Finals tended to be lower-scoring affairs than the matches that took place leading up to them, Grand Finals have been about as likely to produce more points than the season average as to produce fewer points.

One way to demonstrate this is to group and summarise the Grand Finals and non-Grand Finals by the decade in which they occurred.

GF_PPG_CHT.png

There's no real justification then, it seems, in characterising them as dour affairs.

That said, there have been a number of Grand Finals that failed to produce more than 150 points between the two sides - 49 overall, but only 3 of the last 30. The most recent of these was the 2005 Grand Final in which Sydney's 8.10 (58) was just good enough to trump the Eagles' 7.12 (54). Low-scoring, sure, but the sort of game for which the cliche "modern-day classic" was coined.

To find the lowest-scoring Grand Final of all time you'd need to wander back to 1927 when Collingwood 2.13 (25) out-yawned Richmond 1.7 (13). Collingwood, with efficiency in mind, got all of its goal-scoring out of the way by the main break, kicking 2.6 (20) in the first half. Richmond, instead, left something in the tank, going into the main break at 0.4 (4) before unleashing a devastating but ultimately unsuccessful 1.3 (9) scoring flurry in the second half.

That's 23 scoring shots combined, only 3 of them goals, comprising 12 scoring shots in the first half and 11 in the second. You could see that many in an under 10s soccer game most weekends.

Forty-five years later, in 1972, Carlton and Richmond produced the highest-scoring Grand Final so far. In that game, Carlton 28.9 (177) held off a fast-finishing Richmond 22.18 (150), with Richmond kicking 7.3 (45) to Carlton's 3.0 (18) in the final term.

Just a few weeks earlier these same teams had played out an 8.13 (63) to 8.13 (63) draw in their Semi Final. In the replay Richmond prevailed 15.20 (110) to Carlton's 9.15 (69) meaning that, combined, the two Semi Finals they played generated 22 points fewer than did the Grand Final.

From total points we turn to victory margins.

Here too, again save for a period spanning about the first 35 years of the competition during which GFs tended to be closer fought than the average games that had gone before them, Grand Finals have been about as likely to be won by a margin smaller than the season average as to be won by a greater margin.

GF_MPG.png

Of the 10 most recent Grand Finals, 5 have produced margins smaller than the season average and 5 have produced greater margins.

Perhaps a better view of the history of Grand Final margins is produced by looking at the actual margins rather than the margins relative to the season average. This next table looks at the actual margins of victory in Grand Finals summarised by decade.

GF_MOV.png

One feature of this table is the scarcity of close finishes in Grand Finals of the 1980s, 1990s and 2000s. Only 4 of these Grand Finals have produced a victory margin of less than 3 goals. In fact, 19 of the 29 Grand Finals have been won by 5 goals or more.

An interesting way to put this period of generally one-sided Grand Finals into historical perspective is provided by this, the final graphic for today.

GF_MOV_PC.png

They just don't make close Grand Finals like they used to.

A First Look at Grand Final History

In Preliminary Finals since 2000 teams finishing in ladder position 1 are now 3-0 over teams finishing 3rd, and teams finishing in ladder position 2 are 5-0 over teams finishing 4th.

Overall in Preliminary Finals, teams finishing in 1st now have a 70% record, teams finishing 2nd an 80% record, teams finishing 3rd a 38% record, and teams finishing 4th a measly 20% record. This generally poor showing by teams from 3rd and 4th has meant that we've had at least 1 of the top 2 teams in every Grand Final since 2000.

Finals_Summary_Wk3.png

Reviewing the middle table in the diagram above we see that there have been 4 Grand Finals since 2000 involving the teams from 1st and 2nd on the ladder and these contests have been split 2 apiece. No other pairing has occurred with a greater frequency.

Two of these top-of-the-table clashes have come in the last 2 seasons, with 1st-placed Geelong defeating 2nd-placed Port Adelaide in 2007, and 2nd-placed Hawthorn toppling 1st-placed Geelong last season. Prior to that we need to go back firstly to 2004, when 1st-placed Port Adelaide defeated 2nd-placed Brisbane Lions, and then to 2001 when 1st-placed Essendon surrendered to 2nd-placed Brisbane Lions.

Ignoring the replays of 1948 and 1977 there have been 110 Grand Finals in the 113-year history of the VFL/AFL history, with Grand Finals not being used in the 1897 or 1924 seasons. The pairings and win-loss records for each are shown in the table below.

GF_Records.png

As you can see, this is the first season that St Kilda have met Geelong in the Grand Final. Neither team has been what you'd call a regular fixture at the G come Grand Final Day, though the Cats can lay claim to having been there more often (15 times to the Saints' 5) and to having a better win-loss percentage (47% to the Saints' 20%).

After next weekend the Cats will move ahead of Hawthorn into outright 7th in terms of number of GF appearances. Even if they win, however, they'll still trail the Hawks by 2 in terms of number of Flags.

What Price the Saints to Beat the Cats in the GF?

If the Grand Final were to be played this weekend, what prices would be on offer?

We can answer this question for the TAB Sportsbet bookie using his prices for this week's games, his prices for the Flag market and a little knowledge of probability.

Consider, for example, what must happen for the Saints to win the flag. They must beat the Dogs this weekend and then beat whichever of the Cats or the Pies wins the other Preliminary Final. So, there are two mutually exclusive ways for them to win the Flag.

In terms of probabilities, we can write this as:

Prob(St Kilda Wins Flag) =

Prob(St Kilda Beats Bulldogs) x Prob (Geelong Beats Collingwood) x Prob(St Kilda Beats Geelong) +

Prob(St Kilda Beats Bulldogs) x Prob (Collingwood Beats Geelong) x Prob(St Kilda Beats Collingwood)

We can write three more equations like this, one for each of the other three Preliminary Finalists.

Now if we assume that the bookie's overround has been applied to each team equally then we can, firstly, calculate the bookie's probability of each team winning the Flag based on the current Flag market prices which are St Kilda $2.40; Geelong $2.50; Collingwood $5.50; and Bulldogs $7.50.

If we do this, we obtain:

  • Prob(St Kilda Wins Flag) = 36.8%
  • Prob(Geelong Wins Flag) = 35.3%
  • Prob(Collingwood Wins Flag) = 16.1%
  • Prob(Bulldogs Win Flag) = 11.8%

Next, from the current head-to-head prices for this week's games, again assuming equally applied overround, we can calculate the following probabilities:

  • Prob(St Kilda Beats Bulldogs) = 70.3%
  • Prob(Geelong Beats Collingwood) = 67.8%

Armed with those probabilities and the four equations of the form of the one above in bold we come up with a set of four equations in four unknowns, the unknowns being the implicit bookie probabilities for all the possible Grand Final matchups.

To lapse into the technical side of things for a second, we have a system of equations Ax = b that we want to solve for x. But, it turns out, the A matrix is rank-deficient. Mathematically this means that there are an infinite number of solutions for x; practically it means that we need to define one of the probabilities in x and we can then solve for the remainder.

Which probability should we choose?

I feel most confident about setting a probability - or a range of probabilities - for a St Kilda v Geelong Grand Final. St Kilda surely would be slight favourites, so let's solve the equations for Prob(St Kilda Beats Geelong) equal to 51% to 57%.

Each column of the table above provides a different solution and is obtained by setting the probability in the top row and then solving the equations to obtain the remaining probabilities.

The solutions in the first 5 columns all have the same characteristic, namely that the Saints are considered more likely to beat the Cats than they are to beat the Pies. To steal a line from Get Smart, I find that hard to believe, Max.

Inevitably then we're drawn to the last two columns of the table, which I've shaded in gray. Either of these solutions, I'd contend, are valid possibilities for the TAB Sportsbet bookie's true current Grand Final matchup probabilities.

If we turn these probabilities into prices, add a 6.5% overround to each, and then round up or down as appropriate, this gives us the following Grand Final matchup prices.

St Kilda v Geelong

  • $1.80/$1.95 or $1.85/$1.90

St Kilda v Collingwood

  • $1.75/$2.00 or $1.70/$2.10

Geelong v Bulldogs

  • $1.50/$2.45 or $1.60/$2.30

Collingwood v Bulldogs

  • $1.65/$2.20 or $1.50/$2.45