Pies v Saints: An Initial Prediction
/During the week I'm sure I'll have a number of attempts at predicting the result of the Grand Final - after all, the more predictions you make about the same event, the better your chances of generating at least one that's remembered for its accuracy, long after the remainder have faded from memory.
In this brief blog the entrails I'll be contemplating come from a review of the relationship between Grand Finalists' MARS Ratings and the eventual result for each of the 10 most recent Grand Finals.
Firstly, here's the data:

In seven of the last 10 Grand Finals the team with the higher MARS Rating has prevailed. You can glean this from the fact that the rightmost column contains only three negative values indicating that the team with the higher MARS Rating scored fewer points in the Grand Final than the team with the lower MARS Rating.
What this table also reveals is that:
- Collingwood are the highest-rated Grand Finalist since Geelong in 2007 (and we all remember how that Grand Final turned out)
- St Kilda are the lowest-rated Grand Finalist since Port Adelaide in 2007 (refer previous parenthetic comment)
- Only one of the three 'upset' victories from the last decade, where upset is defined based on MARS Ratings, was associated with a higher MARS Rating differential. This was the Hawks' victory over Geelong in 2008 when the Hawks' MARS Rating was almost 29 points less than the Cats'
From the raw data alone it's difficult to determine if there's much of a relationship between the Grand Finalists' MARS Ratings and their eventual result. Much better to use a chart:
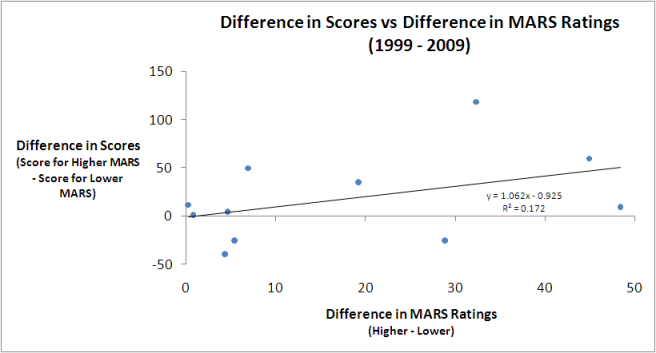
The dots each represent a single Grand Final and the line is the best fitting linear relationship between the difference in MARS Ratings and the eventual Grand Final score difference. As well as showing the line, I've also included the equation that describes it, which tells us that the best linear predictor of the Grand Final margin is that the team with the higher MARS Rating will win by a margin equal to about 1.06 times the difference in the teams' MARS Ratings less a bit under 1 point.
For this year's Grand Final that suggests that Collingwood will win by 1.062 x 26.1 - 0.952, which is just under 27 points. (I've included this in gray in the table above.)
One measure of the predictive power of the equation I've used here is the proportion of variability in Grand Final margins that it's explained historically. The R-squared of 0.172 tells us that this proportion is about 17%, which is comforting without being compelling.
We can also use a model fitted to the last 10 Grand Finals to create what are called confidence intervals for the final result. For example, we can say that there's a 50% chance that the result of the Grand Final will be in the range spanning a 5-point loss for the Pies to a 59-point win, which demonstrates just how difficult it is to create precise predictions when you've only 10 data points to play with.
