Lead Changes as a Measure of Game Competitiveness
/The final victory margin is one measure of how close a contest was, but it can sometimes mislead when the team that's in front midway through the final term piles on a slew of late goals against a progressively more demoralised opponent, improving its percentage in so doing, but also erasing any trace of the fact that the game might have been a close-run thing throughout the first three-and-a-half or more quarters.
An alternative measure, which doesn't suffer this shortcoming, is the number of lead changes that occurred during the game. This statistic is not available for the entire course of every game, but we can instead measure how frequently the team leading at the end of one quarter no longer leads at the end of the next. (For the purposes of this metric I assume that the lead has "changed" if the scores are level at the end of a quarter unless they we also level at the end of the previous quarter.)
The following chart maps how this Average Number of Lead Changes per Game metric has altered over the course of the 116 seasons of AFL/VFL we've had so far:

It portrays the now-familiar story that the competition is, broadly, becoming less competitive - this season a notable example, as the average number of lead changes at main breaks per game is tracking at just 0.51, some 25% lower than the all-Season, all-game average of 0.67.
We can see the declining trend more clearly if we group seasons by eras:

Finals, of course, tend to pit more-closely matched teams against one another, and so might be expected to produce a greater number of lead changes per game. This turns out to be the case, but not to as large an extent as you might imagine:
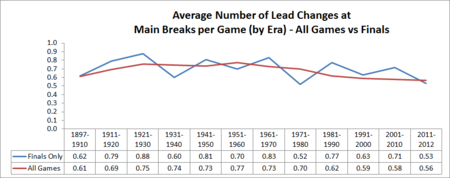
The average number of lead changes per game for all Finals is only 0.69, just a fraction above the all-game average of 0.67. The good news is that the Finals in more recent eras have tended to produce more lead changes than have games in general from the same era - although, here too, the most recent data is not encouraging.
With this metric as our guide, the best Grand Final we might hope for this year would be one where the lead changed hands at every change - that is, where there were 3 lead changes, one at each main break. History reveals that it's been 30 years since we had such a Grand Final, the last one being the 1981 GF between Carlton and Collingwood in which:
- At Quarter Time: Collingwood lead 2.6 to 2.4
- At Half Time: Carlton lead 5.8 to 5.7
- At Three Quarter Time: Collingwood lead 10.10 to 8.13
- At Full Time: Carlton lead 12.20 to 10.12
In fact, the final chart reveals that this is one of only two Grand Finals ever in which there has been lead changes at every break.
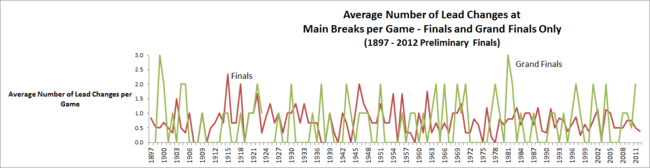
Totting up the numbers, it transpires that there have been only 20 Grand Finals (including two in years where there was a replayed Grand Final) with 2 lead changes, and 32 more with a single lead change. By far the predominant Grand Final type has been one where the same team has lead at every change. There have been 62 such Grand Finals (including three in years where there was a replayed Grand Final). Note that there was no Grand Finals in 1897 or 1924.
Since 1983, 15 of the 30 Grand Finals have been of the type where the same team has lead at every change.
(The red line on the last chart shows the average number of lead changes in the Finals, excluding the Grand Final, for each season. It shows that we've not had a season of Finals redolent with lead changes - that is, one where the average number of lead changes per game topped 1 - since 2004, and none where it's topped 1.25 since 1970.)
