Scoring Shot Conversion History in the VFL/AFL (1897-2015)

The off-season always seems a good time for adopting a more sweeping historical perspective in the analyses here on MatterOfStats. Today we're going to be reviewing Scoring Shot Conversion rates across the 119 seasons of the VFL/AFL from both a venue and a team perspective.

Read More

What's Different About Finals?

Finals, by their nature, tend to pit more-evenly matched teams against one another, on average, than do games from the home-and-away season. It seems reasonable, therefore, to hypothesise that margins will tend to be smaller in Finals than in the home-and-away season, but what other changes in scoring behaviour might we expect to see?

Read More

Modelling Team Scores as Weibull Distributions : Part II

In a previous post I discussed the possibility of modelling AFL team scores as Weibull distributions, finding that there was no compelling empirical or other reason to discount the idea and promising to conduct further analyses to more directly assess the Weibull distribution's suitability for the task.

Read More

Building Your Own Team Rating System

Just before the 2nd Round of 2008 I created MAFL's Team Ratings System, MARS, never suspecting that I'd still be writing about it 5 years later. At the time, I described MARS in the newsletter for that week in a document still available from the Newsletters 2005-2008 section section of this website (it's linked under the "MAFL The Early Years" menu item in the navigation bar on the right of screen). Since then, MARS, as much to my surprise as I think to anyone's, has been a key input to the Line Funds that have operated in each of the ensuing years.
Read More

Is Class More or Less Important In AFL Finals?

You'll hear it said about sport that class emerges when it's needed most. If that applies to football then you'd expect that better teams would be more likely to win games in the Finals than they are games in the regular home-and-away season.
Read More

Evidence for Intra-Game Momentum in AFL Games

So often in the commentary for an AFL game we hear it said that one team or the other "has the momentum going into the break". This blog sets out to examine this claim - how we might interpret it quantitatively and, given that interpretation, whether or not it's true.
Read More

Team Scores - Statistical Distribution and Dependence

In the most recent post on the Simulations blog I assumed that Home Team and Away Team scores were independently and Normally distributed (about their conditional means). I'll investigate both these assumptions in this blog.
Read More

Grand Finals: Points Scoring and Margins

How would you characterise the Grand Finals that you've witnessed? As low-scoring, closely fought games; as high-scoring games with regular blow-out finishes; or as something else?

First let's look at the total points scored in Grand Finals relative to the average points scored per game in the season that immediately preceded them.

GF_PPG.png

Apart from a period spanning about the first 25 years of the competition, during which Grand Finals tended to be lower-scoring affairs than the matches that took place leading up to them, Grand Finals have been about as likely to produce more points than the season average as to produce fewer points.

One way to demonstrate this is to group and summarise the Grand Finals and non-Grand Finals by the decade in which they occurred.

GF_PPG_CHT.png

There's no real justification then, it seems, in characterising them as dour affairs.

That said, there have been a number of Grand Finals that failed to produce more than 150 points between the two sides - 49 overall, but only 3 of the last 30. The most recent of these was the 2005 Grand Final in which Sydney's 8.10 (58) was just good enough to trump the Eagles' 7.12 (54). Low-scoring, sure, but the sort of game for which the cliche "modern-day classic" was coined.

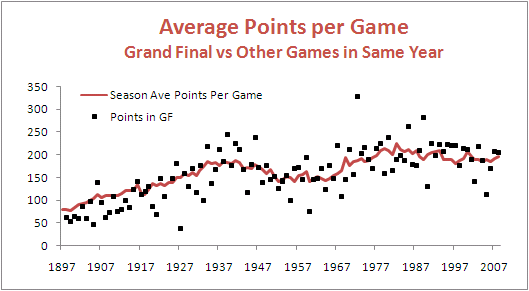
To find the lowest-scoring Grand Final of all time you'd need to wander back to 1927 when Collingwood 2.13 (25) out-yawned Richmond 1.7 (13). Collingwood, with efficiency in mind, got all of its goal-scoring out of the way by the main break, kicking 2.6 (20) in the first half. Richmond, instead, left something in the tank, going into the main break at 0.4 (4) before unleashing a devastating but ultimately unsuccessful 1.3 (9) scoring flurry in the second half.

That's 23 scoring shots combined, only 3 of them goals, comprising 12 scoring shots in the first half and 11 in the second. You could see that many in an under 10s soccer game most weekends.

Forty-five years later, in 1972, Carlton and Richmond produced the highest-scoring Grand Final so far. In that game, Carlton 28.9 (177) held off a fast-finishing Richmond 22.18 (150), with Richmond kicking 7.3 (45) to Carlton's 3.0 (18) in the final term.

Just a few weeks earlier these same teams had played out an 8.13 (63) to 8.13 (63) draw in their Semi Final. In the replay Richmond prevailed 15.20 (110) to Carlton's 9.15 (69) meaning that, combined, the two Semi Finals they played generated 22 points fewer than did the Grand Final.

From total points we turn to victory margins.

Here too, again save for a period spanning about the first 35 years of the competition during which GFs tended to be closer fought than the average games that had gone before them, Grand Finals have been about as likely to be won by a margin smaller than the season average as to be won by a greater margin.

GF_MPG.png

Of the 10 most recent Grand Finals, 5 have produced margins smaller than the season average and 5 have produced greater margins.

Perhaps a better view of the history of Grand Final margins is produced by looking at the actual margins rather than the margins relative to the season average. This next table looks at the actual margins of victory in Grand Finals summarised by decade.

GF_MOV.png

One feature of this table is the scarcity of close finishes in Grand Finals of the 1980s, 1990s and 2000s. Only 4 of these Grand Finals have produced a victory margin of less than 3 goals. In fact, 19 of the 29 Grand Finals have been won by 5 goals or more.

An interesting way to put this period of generally one-sided Grand Finals into historical perspective is provided by this, the final graphic for today.

GF_MOV_PC.png

They just don't make close Grand Finals like they used to.

Pointless v St Kilda

The Swans' 2nd and 3rd quarter performances last Saturday should not go unremarked.

In the 3rd quarter they failed to register a point, which is a phenomenon that's occurred in only 1.2% of all quarters ever played and in just 0.3% of quarters played since and including the 1980 season. Indeed, so rare is it that only one occurrence has been recorded in each of the last two seasons.

Last year, Melbourne racked up the season's duck egg in the 1st quarter of their Round 19 clash against Geelong, leaving them trailing 0.0 to 8.5 at the first change and in so doing setting a new standard for rapidity in disillusioning Heritage Fund Investors. In 2007 the Western Bulldogs were the team who failed to trouble the goal umpire for an entire quarter - the 2nd quarter of their Round 22 game against the Kangaroos.

So, let's firstly salute the rarity that is failing to score for an entire quarter.

But the Swans did more than this. They preceded their scoreless quarter with a quarter in which they kicked just two behinds. Stringing together successive quarters that, combined, yield two points or fewer is a feat that's been achieved only 175 times in the entire history of the game, and 140 of those were recorded in the period from 1897 to 1918.

Across the last 30 seasons only 12 teams have managed such frugality in front of goal. Prior to the Swans, the most recent example was back in Round 14 of 2002 when West Coast went in at half-time against Geelong having scored 4.7 and headed to the sheds a bit over an hour later having scored just two behinds in the 3rd quarter and nothing at all in the 4th. That makes it almost 6-and-a-half seasons since anyone has done what the Swans did on Saturday.

Prior to the Eagles we need to reach back to Round 4 of 1999 when Essendon - playing West Coast as it happens - finished the 1st quarter and the half stuck at 2.2 and then managed just two behinds in the 3rd term. (They went on to record only two more scoring shots in the final term but rather spoiled things by making one of them a major.)

If you saw the Swans games then, you witnessed a little piece of history.

Percentage of Points Scored in a Game

We statisticians spend a lot of our lives dealing with the bell-shaped statistical distribution known as the Normal or Gaussian distribution. It describes a variety of phenomena in areas as diverse as physics, biology, psychology and economics and is quite frankly the 'go-to' distribution for many statistical purposes.

So, it's nice to finally find a footy phenomenon that looks Normally distributed.

The statistic is the percentage of points scored by each team is a game and the distribution of this statistic is shown for the periods 1897 to 2008 and 1980 to 2008 in the diagram below.

Percent_of_Points_Scored.png

Both distributions follow a Normal distribution quite well except in two regards:

  1. They fall off to zero in the "tails" faster than they should. In other words, there are fewer games with extreme results such as Team A scoring 95% of the points and Team B only 5% than would be the case if the distribution were strictly normal.
  2. There's a "spike" around 50% (ie for very close and drawn games) suggesting that, when games are close, the respective teams play in such a way as to preserve the narrowness of the margin - protecting a lead rather than trying to score more points when narrowly in front and going all out for points when narrowly behind.

Knowledge of this fact is unlikely to make you wealthy but it does tell us that we should expect approximately:

  • About 1 game in 3 to finish with one team scoring about 55% or more of the points in the game
  • About 1 game in 4 to finish with one team scoring about 58% or more of the points in the game
  • About 1 game in 10 to finish with one team scoring about 65% or more of the points in the game
  • About 1 game in 20 to finish with one team scoring about 70% or more of the points in the game
  • About 1 game in 100 to finish with one team scoring about 78% or more of the points in the game
  • About 1 game in 1,000 to finish with one team scoring about 90% or more of the points in the game

The most recent occurrence of a team scoring about 90% of the points in a game was back in Round 15 of 1989 when Essendon 25.10 (160) defeated West Coast 1.12 (18).

We're overdue for another game with this sort of lopsided result.