Bookmaker vs Punter Simulations Revisited : Risk-Equalising and LPSO-Like Bookmakers
/In 2011 I introduced the five-parameter model, which I used to simulate the contest between Bookmaker and Punter by making different assumptions about the relative precision and unbiasedness with which they estimated the Home team's victory probability. The fifth parameter in the model was the total overround embedded in team prices by the Bookmaker and, as was my custom at the time, I assumed that the Bookmaker levied this total overround equally on both teams. Now, I think differently.
In this blog I want to revisit those simulations in light of what I now recognise as other possibilities for how the Bookmaker imposes overround on the prices offered for each team. In particular, I want to study how the results of these simulations might change if the Bookmaker's price-setting is consistent with:
- the Log Probability Score Optimising (LPSO) approach in which he sets the Home team price to be the inverse of the sum of his assessment of the Home team's chances and 1.0281%, or
- the Risk-Equalising approach in which he sets the Home team price to be the inverse of the sum of his assessment of the Home team's chances and one half of the total overround he's injecting into the overall head-to-head market.
These two approaches result in somewhat different levels of overround being baked into the Home and the Away team's prices.
I'm also interested in understanding whether the log probability score or the Brier score of the Punter's probability assessments is a better correlate of her wagering profitability.
For all of the simulations in this blog I've assumed that:
- there's a true probability, P, that the Home team wins, which is unknown to the Bookmaker and the Punter
- the Bookmaker's assessment of the Home team's victory probability is distributed Normally, censored at 1% and 99%, with a mean equal to the true probability P plus a bias Bb, which I'll call Bookmaker Bias, and with a standard deviation Sb which I'll call Bookmaker Sigma. We assume that the Bookmaker bias is consistent with the relevant empirical bias for the type of Bookmaker we're considering (see below) and the standard deviation, sigma, lies in the range (+1%, +10%).
- the Punter's assessment of the Home team's victory probability is distributed Normally, also censored at 1% and 99%, with a mean equal to the true probability P plus a bias Bp, which I'll call Punter Bias, and with a standard deviation Sp, which I'll call Punter Sigma. We assume that the bias lies in the range (-10%,+10%) and the standard deviation, sigma, lies in the range (+1%, +15%). A negative bias implies that she tends to underestimate the Home team's true victory probability; a positive bias implies the opposite.
- the random component of the Punter's probability assessment of the Home team's chances is independent of the random component of the Bookmaker's assessment.
- the Bookmaker's Total Overround for every game is fixed at 5%.
- there are 200 games in a season.
- the Home team probability for each game in the season is determined randomly based on the empirical distribution of Home team probabilities for the seasons 2007 to 2012, assuming that the LPSO approach allows us to ascertain unbiased Home team victory probabilities for those games. The main effect of this assumption is a moderate bias towards Home team favourites, which mirrors what we've actually seen in practice. (The average Home team Bookmaker Implicit Probability, using the LPSO approach, is 0.579.)
- the Home and Away team prices are set so as to be consistent with the Bookmaker's Home team probability assessment and the assumption we make about how he levies overround on the two teams, with the caveat that the price of either team can never be less than $1.01. If we're forced to increase one team's price to $1.01 we adjust the other team's to preserve the total overround of 5%.
In conducting the simulations I've assumed that the Bookmaker and Punter Sigma and Bias parameters are fixed for the 200 games of each season, as well as for each of the 1,000 simulations I've made of that season. I've calculated the ROIs for Kelly-staking and Level-staking, and the average Log Probability and Brier scores for each simulated season, then estimated the correlations between these metrics across the 1,000 seasons simulated with the same Bias and Sigma parameters.
What I'm keen to know is:
- The extent to which it matters if the Bookmaker is LPSO-like or Risk-Equalising.
- The combinations of Bookmaker and Punter Bias and Sigma that lead to wagering success under a Kelly-staking or Level-staking approach. (Note that I've allowed the Punter to wager on either the Home or the Away team, or neither, in any single game.)
- The combinations of Bookmaker and Punter Bias and Sigma that make Kelly-staking superior to Level-staking and to not wagering at all.
RESULTS FOR THE LPSO APPROACH
Returns to Kelly-Staking
Firstly, let's explore what we find when we assume that the Bookmaker follows the LPSO approach, which you'll recall means that his assessment of the true probability of the Home team can be derived by calculating 1 / Home Team Price - 1.02891%. If we assume that this is the approach the TAB Bookmaker used for seasons 2007 to 2012, his empirical bias is then zero or very near to it (ie his average calibration error is about 0), so we'll assume it's exactly zero for these simulations.
Under this assumption we find that the return to Kelly-staking is positively related to the Bookmaker's Sigma. So, as you might expect, a Bookmaker whose probability assessments for the Home team are more spread out around (though still centred on) the true probability, is more exploitable than one whose probability assessments tend to cluster nearer the true probability, because such a Bookmaker is more likely to offer a price with a positive expected return to the Punter.
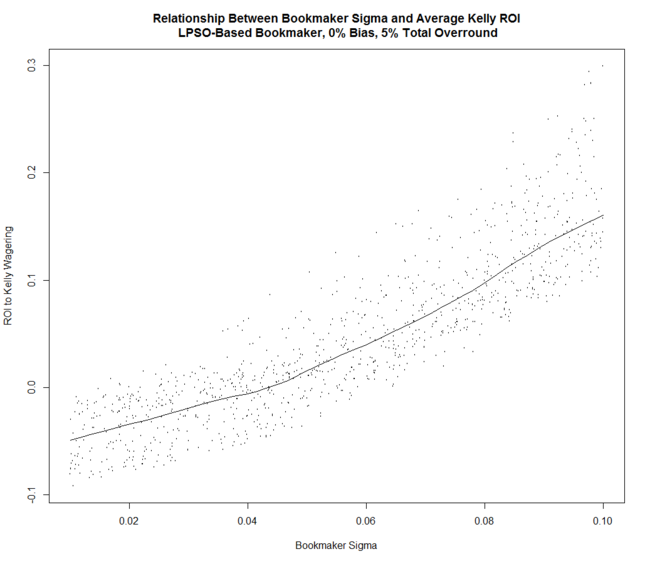
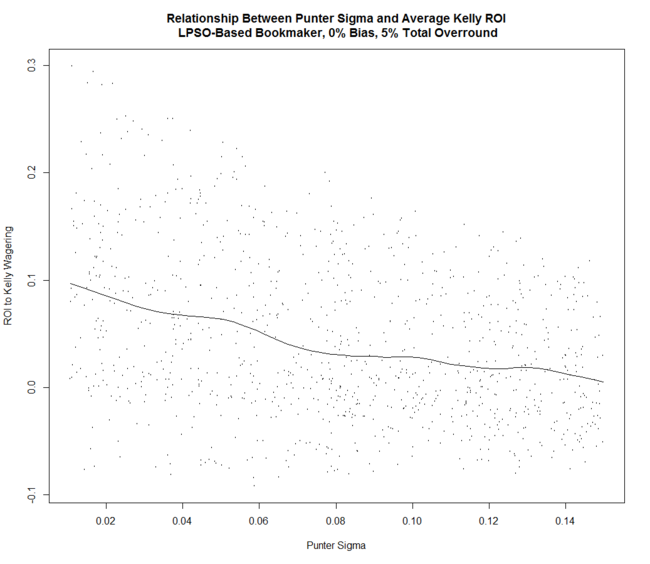
(Each dot in this chart and in all subsequent charts represents the results for a single set of 1,000 simulated seasons each of 200 games, where the five simulation parameters were held fixed across all games and seasons. The line is a loess line fitted using the scatter.smooth function in R with a span of 0.25 and 50 evaluation points.)
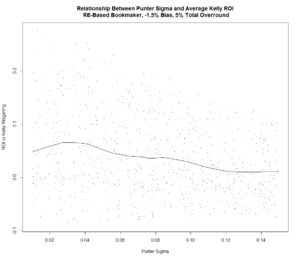
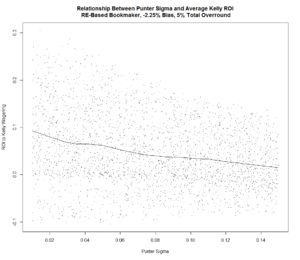
The return to Kelly-staking is negatively related to the assumed value of Punter Sigma. So, as a punter, we want algorithms that tend to produce probability predictions that are less rather than more spread out around the true probability. This makes us more likely to detect profitable opportunities when they arise.
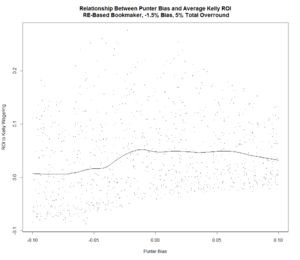
The relationship to Punter Bias is a little more complex. There appears to be an optimal range of biases from about -1% to +4% within which the expected return to Kelly-staking is maximised.
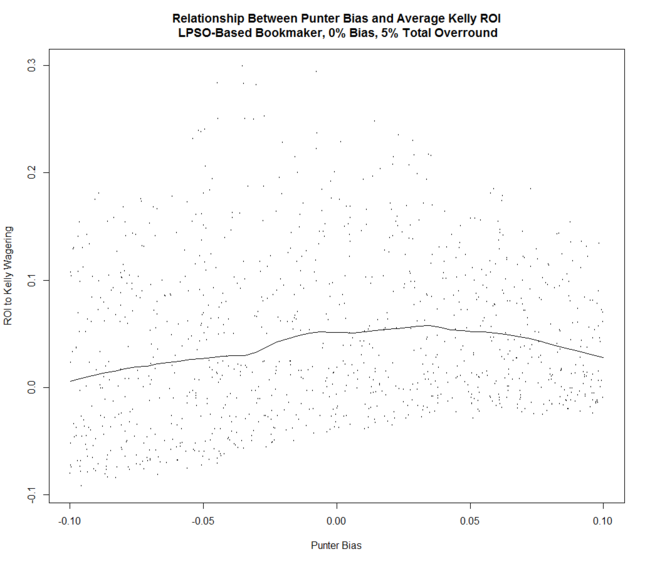
The logic of this result is that, since the Home team generally receives more-favourable treatment in terms of overround from an LPSO-like Bookmaker, a punter will do better if she tends to wager on Home teams more often than Away teams. This will be the case if her Home team probability estimates are biased towards the Home team - at least relative to the bias displayed by the Bookmaker.
Comparison of Kelly-Staking and Level-Staking
If the Bookmaker is LPSO-like, there's little doubt that a Kelly-Staking approach should be preferred to a Level-Staking one since, for 88% of the simulated sets of 1,000 seasons, Kelly-staking, on average, led to higher ROIs than did Level-staking. For further details, see the section on where Kelly-staking is the preferred strategy below.
Comparison of Log Probability Score and Brier Score assuming Kelly-Staking
There's also little doubt that the Log Probability Score should be preferred to the Brier Score as the measure of the predictive ability of any but the least precise predictor.
Using the PART algorithm from the RWeka package and looking only at those simulations where the Bookmaker Sigma was under 7.0% and the absolute value of his and the Punter's Bias was under 5% (ie the most realistic scenarios), the only circumstances in which the correlation between Log Probability Score and the ROI to Kelly-staking was lower than (though opposite in sign to) the correlation between the season Brier Score and the ROI to Kelly-staking was when:
- the Punter Sigma exceeded 8.9%, or
- the Punter Sigma exceeded 6.5% and the Punter Bias exceeded +1%
In all other circumstances, the Log Probability Score of the Punter was more highly correlated with her ROI from Kelly-staking.
Circumstances Under Which Kelly-Staking is Preferable to Level-Staking and Not Betting
Using the same PART algorithm and restricting the focus again to the most realistic, I came up with a small set of rules to describe the parameter values under which the optimal wagering strategy was to Kelly-stake, Level-stake or to keep your money in your pocket.
Here they are, and note that they should be applied sequentially, so that, for example, the second rule only applies when the first does not:
- If the Bookmaker Sigma is greater than 4.4%, Kelly-stake, otherwise
- If the Punter Sigma is greater than 8.2%, Don't Bet, otherwise,
- If the Bookmaker Sigma is greater than 2.5%, Kelly-stake, otherwise
- Don't Bet
RESULTS FOR THE RISK-EQUALISING APPROACH
Returns to Kelly-Staking
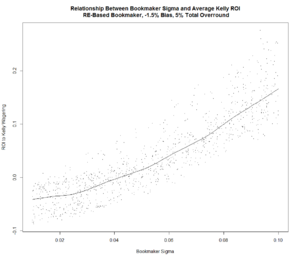
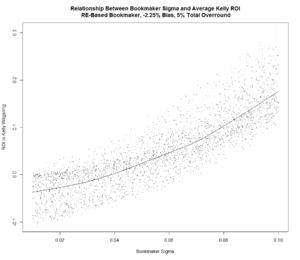
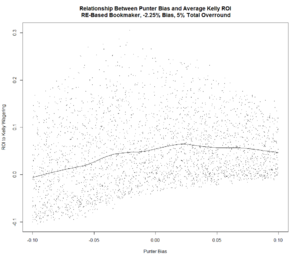
Next, let's see how the results differ if we instead assume that the Bookmaker follows the Risk-Equalising approach, which means that his assessment of the true probability of the Home team can be derived by calculating 1 / Home Team Price - Total Overround / 2. If we assume that this is the approach the TAB Bookmaker used for seasons 2007 to 2012, his empirical bias (ie his average calibration error) turns out to be about -2.25%.
Alternatively, if we compare mathematically the probability assessments that he makes if he's Risk-Equalising with those he makes with an LPSO approach and a fixed overround of 5% they differ by a constant equal to 1.0281% less 2.5%, or about -1.5%. The reason for the difference between this figure and the historical average of -2.25% is because overround has been much higher than 5% for most games across seasons 2007 to 2012.
I've run simulations for the Risk-Equalising approach using fixed biases of both -1.5% and -2.25%.
For either Bookmaker Bias assumption we find that the return to Kelly-staking is positively related to the Bookmaker's Sigma. For any given Bookmaker Sigma, the expected return to Kelly-staking seems to be about the same for both Bookmaker Bias assumptions.
There's a negative relationship between Punter Sigma and the return to Kelly-staking under both Bookmaker Bias assumptions. There also appears to be a very small increase in the average return to Kelly-staking when the Bookmaker Bias is larger.
Lastly, let's look at the relationship between the return to Kelly-Staking and Punter Bias. It's hard to be definitive, but it seems as though a slightly larger positive Bias is preferable for the Punter when the Bookmaker's negative Bias is larger. Beyond some level, however, more Bias is clearly detrimental to profitability.
For any given level of Punter Bias, however, the expected return for the Kelly-Staking Punter seems to be about the same under either Bias assumption for the Bookmaker.
Comparison of Kelly-Staking and Level-Staking
If the Bookmaker is RE-like, under either Bias assumption there's again little doubt that a Kelly-Staking approach should be preferred to a Level-Staking one, since 88% of the simulated sets of 1,000 seasons returned a higher average ROI to Kelly-Staking than to Level-Staking. For further details, see the section on where Kelly-staking is the preferred strategy below.
Comparison of Log Probability Score and Brier Score assuming Kelly-Staking
The superiority of the Log Probability Score over the Brier Score is, if anything, even more apparent if the Bookmaker is RE-like. Here, for the situation where the Bookmaker Bias is -1.5%, the PART algorithm says to prefer the Brier Score only if the Punter Sigma exceeds 8.1%.
Circumstances Under Which Kelly-Staking is Preferable to Level-Staking and Not Betting
Using the PART algorithm once again on the most realistic scenarios, we now derive the following rules for the situation where the Bookmaker Bias is -1.5%:
- If the Bookmaker Sigma is greater than 5.0%, Kelly-stake, otherwise
- If the Punter Sigma is greater than 2.5% and the Bookmaker Sigma is less than 2.9%, Don't Bet, otherwise,
- If the Punter Sigma is greater than 7.1%, Don't Bet, otherwise
- Kelly-Stake
ESTIMATING BOOKMAKER SIGMA
It's fairly obvious from these simulation results that, regardless of whether we assume the Bookmaker is LPSO-like or RE-like and, regardless of which of the two levels of Bookmaker Bias we choose, Bookmaker Sigma is a crucial parameter.
Because we don't know the true Home team probability for any game, it's impossible for us to measure with certainty what the TAB Bookmaker's Sigma actually is.
When I looked at this topic last time around I adopted a quasi-Bayesian approach in which I used the actual game result to update the TAB Bookmaker's pre-game Home team probability assessment. I came up with a range estimate for Sigma of 4.3% to 6.5%.
Today I'll try a different approach.
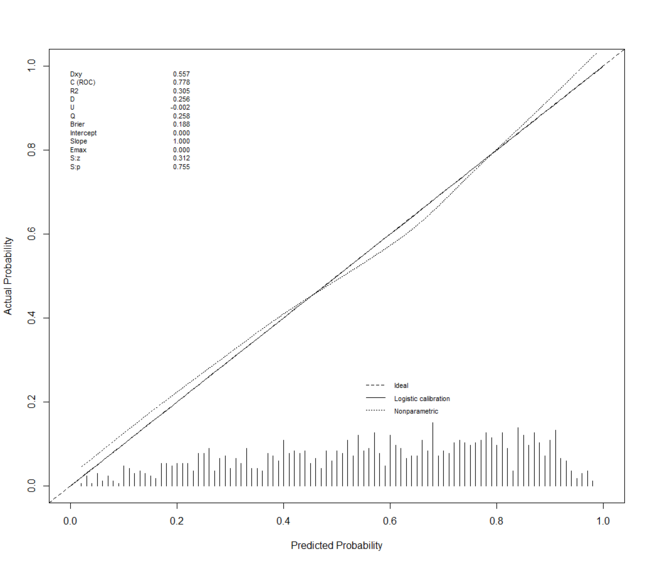
Let's assume though that a model constructed using as inputs the LPSO-Bookmaker probability estimate, the team's MARS Ratings, venue experiences and recent form, as well as the Interstate nature of the clash, can provide a reasonable estimate of the unknown true Home team victory probability.
Such a model is quite well-calibrated, as we can see from this calibration plot (see this post for information about how to read this plot).
 (Though I've not shown it here, a similar model fitted using only the LPSO-Bookmaker probability estimates turns out to be a weaker model than this one, which is comforting as it would otherwise have seemed desperately circular to estimate the standard deviation of LPSO-Bookmaker probabilities from a mean determined using a model with LPSO-Bookmaker probabilities as the sole input. Granted there's still some circularity in what I'm doing anyway, but at least I'm introducing some additional, independent information.)
If we use this model to provide an estimated true Home team probability for every game from 2007 to 2012, then measure the standard deviation of the LPSO-Bookmaker probabilities around these estimated probabilities, we find that Sigma for the TAB Bookmaker is about 5.4%, which is consistent with my previous range estimate. It's also in the range where, our simulations show, Kelly-staking is to be preferred to Level-staking, and where our hypothetical Punter has a shot at expected profitability provided her own Sigma isn't too high and her Bias not too low.
It's interesting to note that a season-by-season estimation of the TAB Bookmaker's Sigma reveals that there's been no single season where it has exceeded 6.2%, which was the threshold we found above for Kelly-staking to be more likely than not to be profitable.
SUMMARY
Firstly, if we're facing a Bookmaker who is Risk-Equalising or LPSO-like in his approach:
- Kelly-staking is generally to be preferred to Level-staking, especially in those situations where our predictive skills relative to the Bookmaker's are such that a profit is possible.
- The Log Probability Score is to be preferred to the Brier Score (BS) as the measure of our predictive models because the Log Probability Score is generally more highly correlated with the returns to Kelly-staking for the most realistic scenarios.
Secondly, our general expectation of profitability from Kelly-staking is contingent upon the Sigma of the Bookmaker we're facing, which is not something we can readily control. The empirical evidence suggests that we've been quite near to the boundary (ie about 5%) where the Bookmaker's Sigma has been large enough to make profitability more likely than not.
Lastly, where we do find ourselves in a more-favourable wagering environment, capitalising on it requires that our own Sigma not be too high and that we don't bias our own Home team probability estimates in a way that prevents us from benefiting from the generally lower levels of overround levied on Home teams and/or the TAB Bookmaker's general under-estimation of the Home team's chances in a contest.
