Estimating Bookie Bias and Variability in Home Team Probability Assessments
/This blog is another in the series of blogs about simulating the contest between bookmaker and punter (for details see the 1st blog, 2nd blog, 3rd blog, and 4th blog in the series). In these blogs we've estimated how the bias and variability in a bookmaker's home team probability assessments relative to the bias and variability in the punter's assessments, effects the likelihood of the punter making a profit.
So far, even I'd be forced to admit that this has all been fairly theoretical as we've lacked any empirical measures of these biases and variabilities. In this blog we'll address this deficiency and come up with estimates for the historical bias and variability of the bookie's probability assessments.
To calculate the true bias and variability of a bookmaker's home team probability assessments we'd need to know what the true home team probability was for every game, which is inherently unknowable information. What we do have, however, are two pieces of information with which to estimate that true probability: the bookie's pre-game assessment and the actual victory margin in the game itself.
It seems reasonable to assume that (he says, rapidly adopting the passive voice), providing we can convert an actual victory margin into a probability, the true home team probability should lie somewhere between the bookie's pre-game assessment and the probability implied by the victory margin.
First then we need a way to convert the actual home team victory margin into a probability. One way to do this would be to use the equation that we've discovered before linking the bookie's victory margin expectation to his implicit probability assessment, which was:
Predicted Victory Margin = 22.3 ln(Probability / (1-Probability))
Rearranging this gives:
Probability = exp(Predicted Victory Margin/22.3)/(1+exp(Predicted Victory Margin/22.3))
Using this formulation, in essence what we're answering is the following: had the bookmaker offered a margin equal to the actual final victory margin, what probability would he have attached to the home team?
Another, somewhat similar way to proceed would be to use the fact that Handicap Adjusted Margins are approximately Normally distributed (with a standard deviation of around 37.7 points), in which case we can use the Cumulative Density Function for the Normal distribution to convert a victory margin into a probability, again assuming that the handicap offered was equal to the actual final margin.
What I hadn't realised until today was that these two approaches are, for all practical purposes, the same. The chart below shows the mapping between victory margin and assessed probability using the two methods:
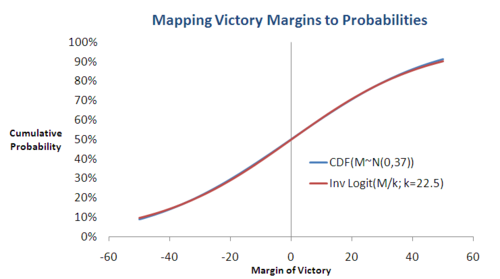
(Note that I've used 22.5 as the multiplier in the first equation and 37 as the standard deviation for the Normal distribution, which are both slightly different from the numbers in the earlier blogs but similar enough that this does not matter.)
In absolute terms, the difference between the two approaches is never more than 1% and it's only that large at the extremes (ie victory margins of -50 and +50 points). Doubtless someone else has discovered this near-equivalence before, but it's not something I've run across.
Anyway, whichever method we choose, we now have a way of mapping an actual victory margin to an estimate of the home team's true victory probability. For example we can say that a Home team that won by 35 points would have been most likely to do this had it carried a pre-game probability of about 83%.
We'll combine this post-game probability estimate with the pre-game estimate of the bookmaker using a simple proportionate mix in a vaguely Bayesian way:
Estimated True Home Team Probability = Alpha x Bookie's Pre-Game Probability Estimate + (1-Alpha) x Post-Game Probability Estimate
Choosing a value for Alpha (which we hold constant for every game) we can then proceed to estimate true Home team probabilities for every game, and thus the average bias and variability of the bookie's probability assessments across a series of games.
The table below shows the results of performing these calculations using various values for Alpha and across four different time periods:
- All of 1999 to the end of Round 5 in 2011
- From the start of 2006 to the end of Round 5 in 2011 (which is the period of time for which I can vouch for the bookie data)
- For all of 2010
- For the first 5 rounds of 2011
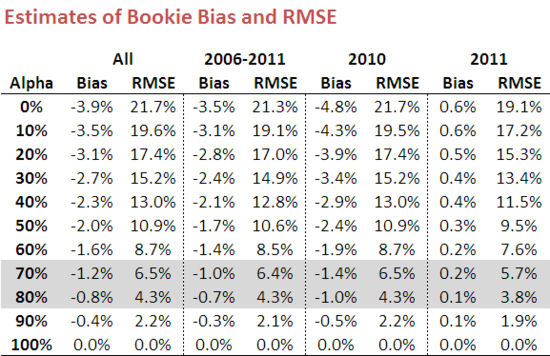
As Alpha increases towards 100% we assume that the bookie's pre-game probability assessment was closer and closer to the true probability and so the estimated bias and variability (for which in this table I've used RMSE) shrinks towards zero.
Conversely, as Alpha decreases towards 0% we assume that the bookie's pre-game probability assessment becomes progressively less relevant, and instead base our estimate of the true probability more on the actual victory margin.
The first and last rows of the table therefore provide a logical range of estimates for the bookie's bias and variability. Statistically speaking, the decision to lean towards small or large values of Alpha should be based on your assessment of the relative precision of the two probability estimates contributing to the average. For mine, since the bookmaker's assessment is (presumably) based on years of experience and a vast range of relevant variables - team composition, recent form, game venue, and so on - whereas the victory-margin based assessment hinges on a single piece of data from a single game on a single day, my instinct is to lean towards larger values of Alpha.
For this reason, I've shaded the rows for Alpha values of 70% and 80% as representing the range I'd deem most relevant. That would mean that, over the entire period from 1999 to 2011, the bookie's tendency has been to understate the Home team's true victory probability by about 1% (hence our predilection for wagering head-to-head on Home teams only) and the bookie's RMSE has been about 4.5-6.5%, which is only a little larger than I'd have guessed.
Regardless of the value of Alpha that you choose (unless you choose 100%, in which case you'd be wagering, if you wagered at all, with no genuine hope for long-term profitability), as a punter you'd be a little disheartened by the bookie numbers for bias and RMSE in 2011. We've seen in the previous blogs that the likelihood of profitable punting increases with greater bias and greater variability in bookmaker probability assessments, but so far in 2011 the bookie has shown lower than average bias and variability. I do hope he's not getting better at his job.
