MatterOfStats 2014 : Team Dashboard for Round 16
/The Swans this week extended their winning streak to 11 games, four better than any other team in the competition
Read MoreThe Swans this week extended their winning streak to 11 games, four better than any other team in the competition
Read MoreOnly three of the teams currently sitting in Finals positions have winning streaks that extend beyond a single game, if they've a winning streak at all. Four of the teams in that Top 8 have lost two of their last three games, and another, Geelong, has only a 5 and 4 record in its most-recent 9 games.
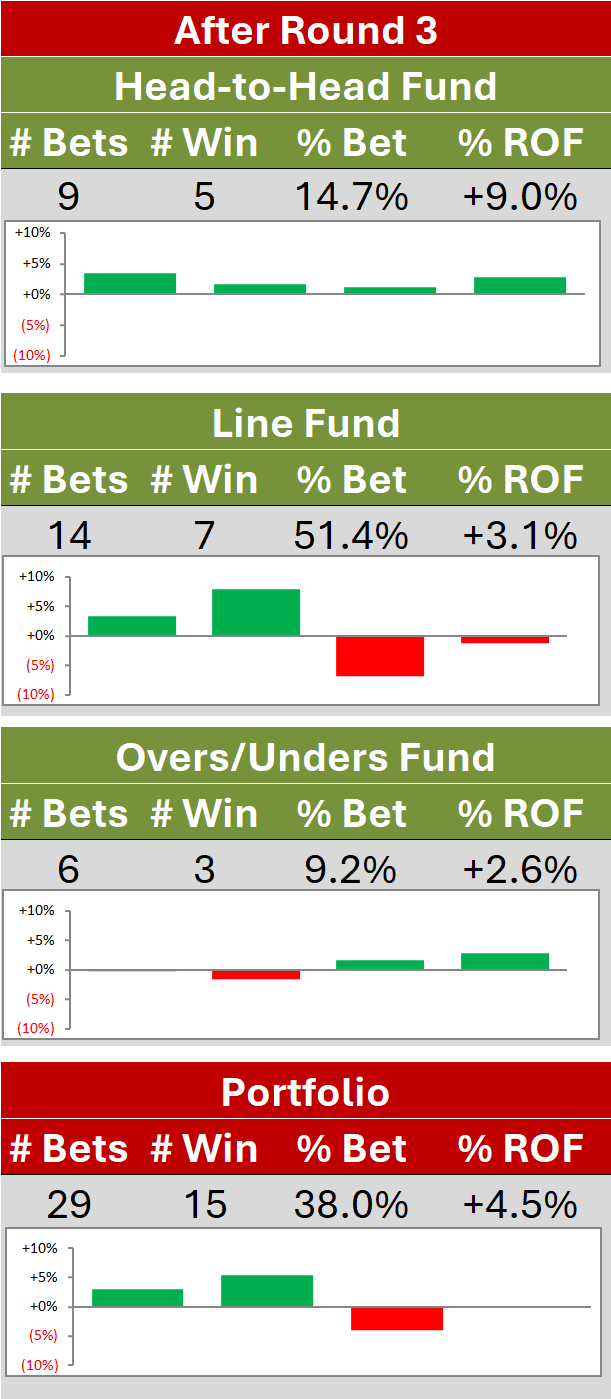
Based on the MatterOfStats Win Production Function, three teams have won 1 or more games fewer than would be expected based on their Scoring Statistics:
Three teams have, conversely, won 1 on more games more than would be expected:
The top 11 teams on the competition ladder now all have percentages greater than 100, while four of the bottom five teams have percentages under 80. Seven teams have won four or fewer of the 13 games they've played, which means that an 8 and 5 season record is currently necessary to place a team in the top 8. As well, the top 3 teams have registered almost 21% of the points scored during the season - almost exactly the same proportion as registered by the bottom 5 teams combined.
All of which suggests that, perhaps, the early-season hopes for a highly-competitive 2014 are not entirely panning out.
This week's Team Dashboard reveals an unusual feature of this week's results: four of the teams currently in the Top 8 recorded losses and only one of those losses (Port Adelaide's) was to another team in the Top 8.
Read MoreAll seven of the teams now sitting atop the competition ladder collected wins this weekend, and six of them have a winning streak extending back to at least the two most recent games.
More remarkable perhaps is the fact that all of the teams in the top 11 places have percentages greater than 100, yet four of them have not registered more goals than they've registered behinds and two more of them have a barely positive surplus.
Equally remarkable is the fact that Melbourne, currently, has the best record of all the teams on the basis of Opponent Scoring Shot conversion, while their conquerors of the current round, Collingwood, have the worst Own Scoring Shot conversion rate of all 18 teams.
By my, crude assessment, the average impact of the bye on teams this season has been a wash, with nine teams winning and nine losing in the week immediately following their bye. Three of the teams that lost currently sit in the Top 8 on the competition ladder, and six sit outside the Top 8. Winning and losing, it seems, has been more about pure ability than the disruptive or beneficial influence of the week off.
Speaking of the competition ladder, according to the Win Production Function used here at MatterOfStats, five teams have won about 1 game or more this season than their Scoring Shot Data would suggest they're entitled to have won:
Five more teams have lost about 1 game or more than they "should" have:
The eight remaining teams are all within one-half a game of what they could reasonably expect given their Scoring Shot performances. Again this year then, the Win Production Function seems to be doing a reasonable job of predicting the link between scoring and success.
In winning its final term against Carlton this weekend, the Brisbane Lions ensured that every team has now won every quarter at least once during the season. No team has won any single quarter more than 80% of the time, this result having been achieved by Geelong and Sydney in 1st Quarters, Hawthorn in 2nd Quarters and, remarkably, by Port Adelaide in 1st, 3rd and 4th Quarters.
Just a handful of comments this week based on the Quarter-by-Quarter analysis:
For this week's Team Dashboard commentary I'm going to focus on the rank correlations between the teams' ranking on various of the metrics on the Team Dashboard and their ranking on the competition ladder (using my approach to ordering teams that have played different number of games, which is to calculate competition points secured per game played).
These rank correlations are as follows:
In an historical context these correlations are generally quite low, most startlingly so for the correlation between Ladder Position and Own Scoring Shot Conversion, which at +0.09 is about as close to perfectly uncorrelated as you can get.
Six teams in particular are driving this low correlation, three from the bottom half of the Ladder:
... and three from the top half of the Ladder:
Scoring Shot creation has been the most important activity for teams so far this season (hence the +0.88 correlation with Ladder position). Converting those scoring shots has been of far less importance because winning teams have, on average, generated almost 8 more scoring shots per game than their opponents (27.8 shots versus 19.9). Using these averages we can calculate that a winning team registering 27.8 scoring shots and converting at only 50% will prevail over a losing team registering 19.9 scoring shots and converting at a much higher 77%.
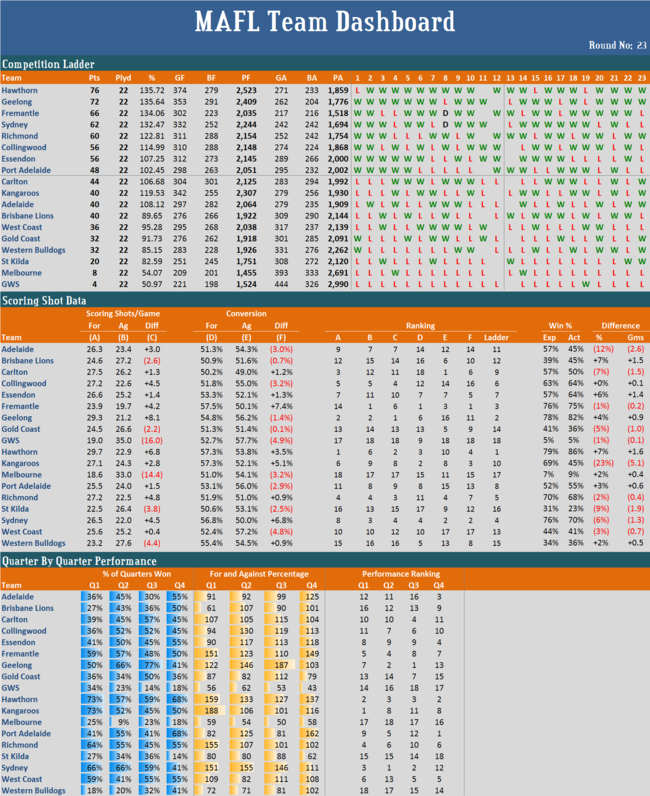
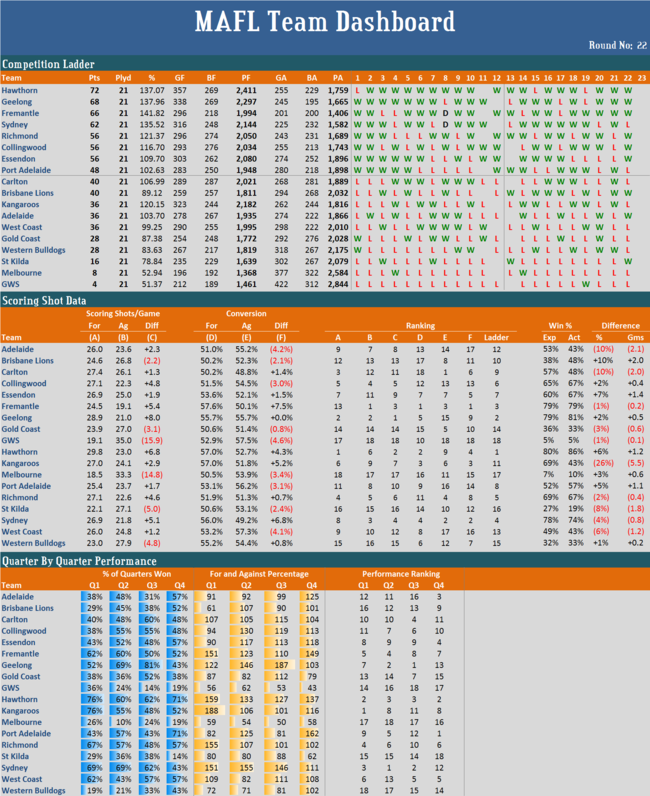
The latest Team Dashboard appears below. Please note that I rank teams firstly on the basis of points scored per game played then on percentage, which will mean that I rank some teams differently from the official AFL Ladder.
The only comment I'll make this week is that we're still waiting for the Lions to win a final term, for Geelong to lose a 1st term, and for Port Adelaide to lose a 3rd term.
With seven rounds now completed, time then I think to once again review the more substantial differences between each team's ladder position and its ranking on the various Dashboard metrics:
The Suns have now risen as far as 6th place on the competition ladder despite having a sub-100 percentage, and Essendon have fallen to 12th with a percentage near 105.
In other curiosities, the teams currently in 4th and 5th spots (Collingwood and the Kangaroos) have both scored fewer goals than the team in 16th (Carlton) and fewer than eight other teams below them on the ladder.
What's more, Collingwood, who sit in 4th place on the ladder, have the 2nd-worst conversion rate of all teams, while the Dogs, who sit in 15th, have the 2nd-best conversion rate, and the Lions, who sit in last position, have the 4th-best conversion rate.
The Brisbane Lions are the only team to have failed to win a specific quarter in six attempts. In fact, they've done this for two quarters, having 0 from 6 records in 3rd and in 4th quarters. Conversely, Port Adelaide are the only team to have won all 6 of any quarter, this being the case for 3rd quarters in their games where they've this perfect record. In those quarters they have, in aggregate, outscored their opponents by more than 2:1.
It's surely been a while - though I've not formally checked the record - since a team with a percentage below 85 has sat with a notional Finals spot five games into a season.
Read MoreThe latest Team Dashboard includes the following pieces of information:
The latest Team Dashboard reveals that, among other things:
It's too early in the season to be attempting to discern meaningful trends or statistics from the MatterOfStats Team Dashboard, but a handful of results are at least interesting:
The Team Dashboard after Round 1 is below. Most of the content is, I hope, self-evident, but here's a brief overview of the Dashboard's contents.
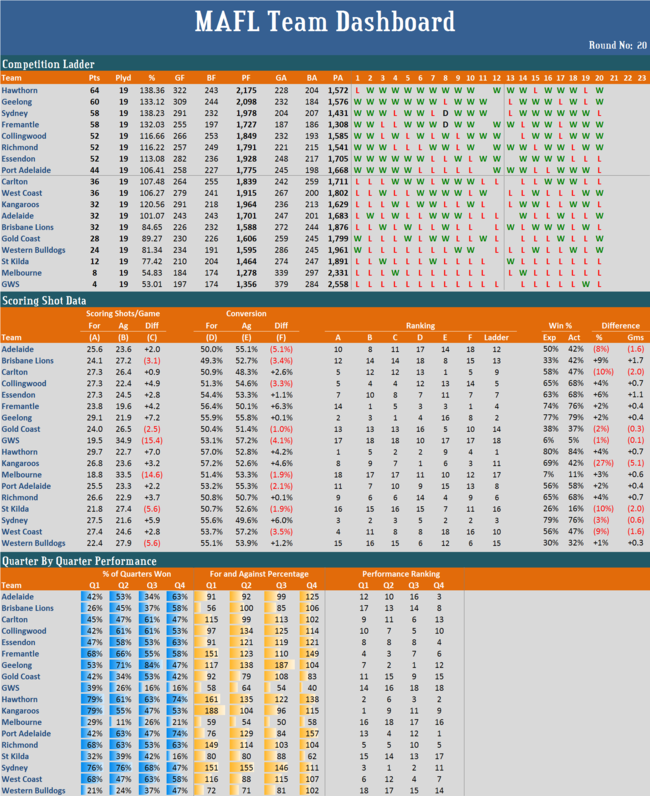
This section provides most of the information that you'll find in a standard, extended competition ladder, including the goals and behinds scored and conceded by each team. It also shows the teams W/D/L performance for every game of the season.
This section, as its name suggests, focusses on the scoring statistics for each team and includes the average number of scoring shots recorded and conceded, the conversion rate - goals / (goals + behinds) - achieved and allowed, and the ranking of each team on each of these metrics.
The far right of this section compares each team's winning percentage with that which we'd expect based on that team's scoring behaviour. It uses the Win Production Function described in this blog post from 2011.
This final section provides details about each team's winning percentage and scoring percentage (points scored divided by points conceded multiplied by 100) in each quarter of the game taken separately.
Team rankings for each quarter are also provided, these based firstly on winning percentages, with scoring percentage used to break ties.
Before providing the final Team Dashboard of the season I want to present a summary view of each team's performance this season, which I've done by creating a bubble chart where the area is proportional to the victory margin in the relevant game and the colour reflects the result from the viewpoint of the Home team.
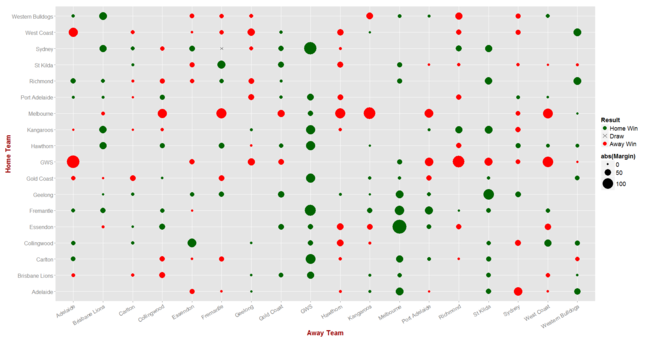 One aspect of the season that I think this chart makes particularly clear is the general narrowness of the Roos' defeats. To see this, peruse the collection of small, red circles on the row labelled "Kangaroos" and the assemblage of small, green circles - which also denote Roos losses - in the column labelled similarly.
Also highlighted by this chart is the magnitude of many GWS and Melbourne losses and, more subtly, the inequity of the home-and-away clashes that were missed as a consequence of the non all-plays-all home-and-away nature of the AFL draw. Which team wouldn't, for example, want one of those large green circles that proliferate in the columns labelled "GWS" or "Melbourne"?
With that by way of entree, here's the season's final Team Dashboard:
 (I've left the Dons in 7th though I realise that, officially, they'll finish 9th.)
The Roos, therefore, have missed out on a place in the Finals despite finishing the season having scored, on average, about 20% more points than their opponents, ranking them 5th amongst all teams, while Port Adelaide have made it after racking up only a bit over 2% more points than they conceded.
Somewhat unusually, half of the teams that have lived to fight another week found themselves on the end of a loss this week, while five of the teams that won't participate in the Finals were victorious. The end of any AFL season is often a curious time ...
At the end of the home-and-away season only two teams have recorded more than two wins fewer than would have been expected based on their scoring shot data and MAFL's Win Production Function: Adelaide, who recorded 2.6 wins fewer, and the Roos, who recorded over 5 wins fewer. No team recorded more than 1.6 wins more than would have been expected, and half of the teams finished within 1 win - plus or minus - of the number we'd have expected.
Hawthorn finished the home-and-away season as the team generating the greatest number of scoring shots per game, while the Dees finished as the team generating the fewest. Fremantle conceded the fewest and GWS the greatest number per game.
Fremantle also recorded the highest scoring shot conversion rate, and Carlton the lowest, while GWS allowed the greatest proportion of scoring shots to be converted to goals and Carlton allowed the smallest proportion - how else could the Blues have hoped to have made the Finals given their own inability to convert?
The Roos were best at 1st Quarters, Sydney at 2nd Quarters, Geelong at 3rd Quarters, and Port Adelaide at 4th Quarters, while worst, respectively, were the Dogs, Dees, Giants and the Saints.
Rank correlations between final ladder position and ranking on the various metrics were as follows:
This year, it seems, success was very much about ensuring that opponent's scoring opportunities were hard to convert and about performing especially well in 2nd terms.
Should Port Adelaide defeat Carlton next week and, as some are suggesting might the case, the Dons are excluded from the Finals or choose not to participate, then it's possible we'll have a team, the Brisbane Lions, playing in the Finals with a percentage below 90 and another team, the Roos, not playing despite recording a percentage during the home-and-away season above 120.
In truth, even if they lose, Carlton would still be favoured to grab any vacated Finals berth however, as the scenario just outlined would require that the Lions draw with or defeat the Cats, which seems unlikely, especially in light of the Lions' near loss to the lowly Dogs this week after leading by over 50 points..
Here's the latest Team Dashboard, revealing that the competition's finalists are now all but resolved and that the makeup of the Top 4 is completely determined, if not their ordering.

It's been a little while since we looked at the strengths and weaknesses of each team in terms of the metrics on the MAFL Team Dashboard, so let's do that this week:
Having read that list, it's probably no surprise that the weakest rank correlation between competition ladder position and ranking on any single metric is for Opponent Conversion rate, for which it is only +0.18. The next-weakest correlation is with Own Conversion rate where it's +0.51.
Strongest correlations are for Opponent Scoring Shots per game (+0.93), and for performances in 2nd Quarters (+0.92). Surprisingly - to me anyway - the correlation between performances in final terms and competition ladder position is a relatively weak +0.60.
MAFL is a website for ...
(For those not wanting to use PayPal, my email address below is now also a PayID)
![]() Click on the envelope
Click on the envelope
Copyright © 2006-2025, Tony Corke. All rights reserved.