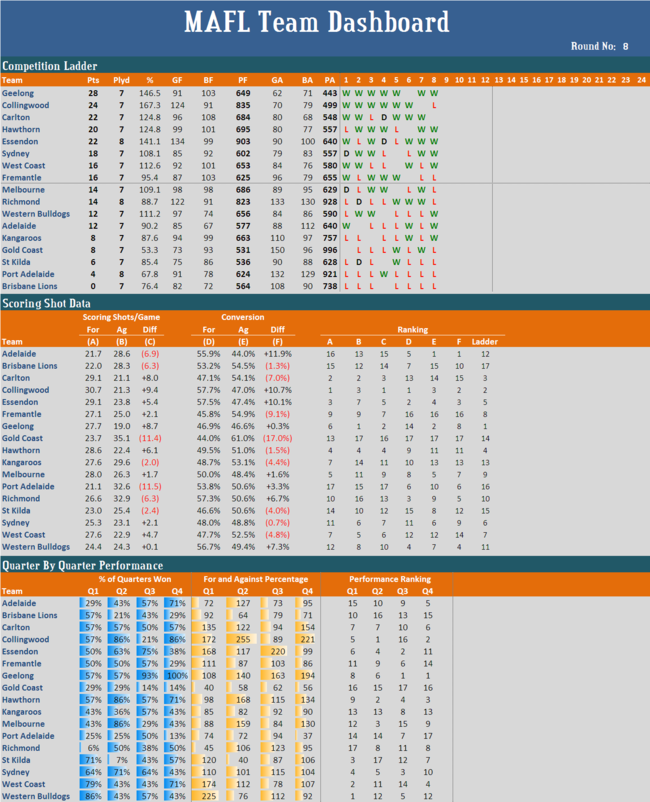
MAFL 2011 : Team Dashboard for Round 8
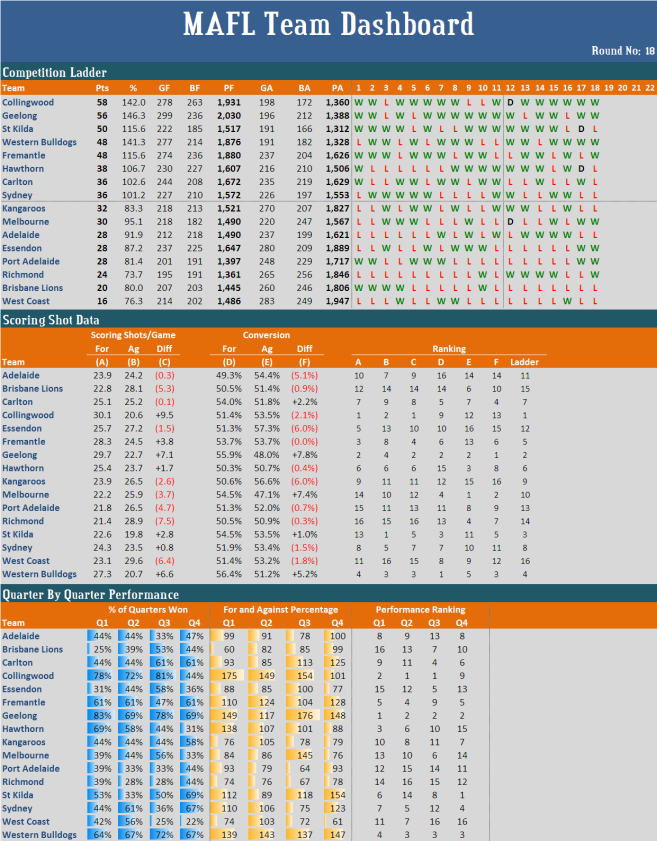
Relative to each team's respective ladder position, here's where its dashboard metrics are anomalous: 

  • Adelaide: 12th on the ladder but 5th on Own Conversion rate and 1st on Opponent Conversion rate (the problem is that its 16th on Own Scoring shots and 13th on Opponent Scoring shots). Also, 5th on final term performances.
  • Brisbane Lions: 17th on the ladder but 7th on Own Conversion rate (but alas 15th on Own Scoring shot production. Also, 10th on 1st-quarter performances (though still with a sub-100 percentage for the term).
  • Carlton: 3rd on the ladder but 13th on Own Conversion rate and 14th on Opponent Conversion rate (offset by being 2nd on Own Scoring shot production and 3rd on Opponent Scoring shot production). Variously 6th to 10th on quarter-by-quarter performances, with a particularly poor record in 3rd terms.
  • Collingwood: 2nd on the ladder but 16th on 3rd term performances, with a sub-100 percentage for that term. However, its percentages for 2nd and 4th terms are both over 200.
  • Essendon: 5th on the ladder but 11th on final terms, though still with a near 100 percentage for that term (and with a 220 percentage for 3rd terms).
  • Fremantle: 8th on the ladder but 16th on both Own and Opponent Conversion. Also, 14th in final terms. 
  • Geelong: 1st on the ladder but 14th on Own Conversion and only 6th on Own Scoring Shot production. Also, 8th on 1st terms.
  • Gold Coast: 14th on the ladder but no better than 15th in any single term and with percentages in every term 62 or lower.
  • Hawthorn: 4th on the ladder but 9th on Own Conversion rate and 11th on Opponent Conversion rate. Also, 9th on 1st term performances.
  • Kangaroos: 13th on the ladder but 7th on Own Scoring shot production.
  • Melbourne: 9th on the ladder but 3rd on 2nd term performances and 15th on 3rd term performances.
  • Port Adelaide: 16th on the ladder but 6th on Own Conversion (wasted by being 17th on Own Scoring Shot production). Also, 7th on performances in the 3rd term.
  • Richmond: 10th on the ladder but 16th on Opponent Scoring Shot production, ameliorated to some extent by being 3rd on Opponent Conversion. Also, 17th on 1st term performances and still yet to win a 1st term in any game.
  • St Kilda: 15th on the ladder but 8th on Opponent Conversion . Also, 3rd on performances in the 1st term, 7th in final term performances, and 17th on 2nd term performances and yet to win a 2nd term in any game, having been outscored by more than 2-to-1 in 2nd terms so far.
  • Sydney: Fairly unremarkable in all respects, save perhaps for slightly sub-par performances in the final term.
  • West Coast: 7th on the ladder but 12th on both Own and Opponent Conversion, offset in particular by being 5th on Opponent Scoring Shot production. Also, 2nd on 1st term performances and 14th on 3rd term performances.
  • Western Bulldogs: 11th on the ladder but 4th on Own Conversion. Also, 1st on 1st term performances (with a 225 percentage) and 5th on 3rd term performances.


MAFL 2011 : Team Dashboard for Round 7

A handful of comments on the Quarter-By-Quarter Performance section this week: 

  • Three teams are undefeated for one of the quarters in all of their matches: Collingwood and Geelong in final terms, and Melbourne in 2nd terms
  • Richmond have yet to win a 1st term; they've drawn only one in their seven games
  • St Kilda have yet to win a 2nd term; they've drawn only one in their six games
  • The Dogs, despite filling the 11th spot on the ladder (as I construct it), have the best 1st term record in the League
  • Melbourne have the best 2nd term record in the League (but the 15th best for each of the terms on either side)
  • Geelong have the best 3rd term record, and the Pies the best final term record in the League


MAFL 2011 : Team Dashboard for Round 3

It's still far too early to be reading much into the MAFL Team Dashboard numbers, but I will highlight a few things: 

  • The nine teams highest on the ladder all have percentages above 100, but only four of them have converted at better than 50%. Of the remaining eight teams, four of them have converted at better than 50%, and one more has converted at exactly 50%. The early signs are, therefore, that this season's going to be more about creating scoring opportunities than converting them (to a point).
  • Collingwood are ranked 1st or 2nd on all Scoring Shot metrics except Opponent Conversion for which they rank 8th having allowed their opponents to convert exactly 50% of their scoring shots into goals.
  • Carlton, Fremantle, Hawthorn and West Coast are other higher-ranked teams with relatively poor Opponent Conversion rates.
  • Geelong's problem is, instead, Own Conversion on which it ranks 13th having converted at just under 46%. Sydney and Hawthorn are other higher-ranked teams with a similar problem.
  • Adelaide's won both of their 3rd and 4th quarters this season, Carlton's won every 1st quarter this season, Collingwood's won every 2nd and 4th quarter, Geelong's won every 3rd and 4th quarter, Melbourne's lost every 1st and won every 2nd quarter, and the Dogs have won every 1st quarter. Gold Coast are yet to win a single quarter.
  • Collingwood has a percentage of over 100 for all four quarters and has outscored their opponents in 2nd quarters by 3:1. Hawthorn also has a percentage of over 100 for all four quarters, and Geelong very nearly does too.
  • Four teams have been, in aggregate, outscored in every quarter: the Lions, Gold Coast (and how), the Roos, and Port Adelaide.


MAFL 2010 : Team Dashboard for Round 18

The MAFL Team Dashboard for Round 18 is below.

Here are a few statistical highlights for each team chosen because the statistic illuminates sustained performance is at the extremes or anomalous performance relative to a team's ladder position:

Collingwood
  • Kicked 2nd most goals (278)
  • Kicked most behinds (263)
  • Have the 2nd best percentage (142.0)
  • Ranked 12th on opponent conversion rate (53.5%)
  • Ranked 9th on Q4 performances (44% of quarters won, 101 percentage)
Geelong
  • Kicked most goals (299) and most total points (2,030)
  • Only team to have kicked 2,000 points in the season
  • Have the best percentage (146.3)
  • Ranked 1st or 2nd for performances in every match quarter
St Kilda
  • Kicked fewest goals of any team in the top 8 (222)
  • Conceded fewest goals of any team in the competition (191, level with the Dogs) and fewest total points (1,312)
  • Ranked 13th on scoring shots per game (22.6) but 1st on opponent scoring shots per game (19.8)
  • Ranked 14th on Q2 performances (33% of quarters won, 89 percentage) and 1st on Q4 performances (69% of quarters won, 154 percentage)
Western Bulldogs
  • Conceded fewest goals of any team (191, level with the Saints) and 2nd fewest total points (1,328)
  • Ranked 1st on conversion rate (56.4%)
  • Ranked 1st on 'team most difficult to comment about' metric (aeq with the Roos - 2 comments ... well, now 3)
Fremantle
  • Conceded the most goals of any team in the top 8 (237)
  • Ranked 3rd on scoring shots per game (28.3)
  • Ranked 13th on opponent conversion rate (53.7%)
  • Ranked 9th on Q3 performances (47% of quarters won, 104 percentage)
Hawthorn
  • Kicked only 3 more goals than behinds (230 vs 227)
  • Ranked 15th on conversion rate (50.3%) but 3rd on opponent conversion rate (50.7%)
  • Ranking of match quarter performances declines from earlier to later quarters: ranked 3rd for Q1 performances and 15th for Q4 performances
Carlton
  • Conceded most behinds of any team in the top 8 (219) and 2nd most goals (235)
  • Worst record for 2nd half of season of any team in the top 8 (2-5)
  • Have a better than 100 percentage for Q3 and Q4 and a worse than 100 percentage for Q1 and Q2
Sydney
  • Worst percentage of any team in the top 8 (101.2)
  • Ranked 5th on opponent scoring shots per game (23.5)
  • Ranked 12th on Q3 performances (36% of quarters won, 75 percentage) and 4th on Q4 performances (67% of quarters won, 123 percentage)
Kangaroos
  • Worst percentage of any team in the top 12 (83.3)
  • Ranked 15th on opponent conversion rate (56.6%)
  • Ranked 1st on 'team most difficult to comment about' metric (aeq with the Dogs)
Melbourne
  • Conceded most behinds of any team in the top 13 (247)
  • Better record for 2nd half of season than the three teams above them on the ladder
  • Ranked 1st on opponent conversion rate (47.1%) and 4th on own conversion rate (54.5%)
  • Ranked 14th on scoring shots per game (22.2)
  • Ranked 6th on Q3 performances (56% of quarters won, 145 percentage)
Adelaide
  • Better record for 2nd half of season than the four teams above them on the ladder
  • Worst conversion rate of any team (49.3%)
  • Ranked 13th on Q3 performances
  • Have lost more than they've won of every match quarter
Essendon
  • Kicked the most goals of any team not in the top 8 (237), the most behinds (225) and the most points (1,647)
  • Conceded the most goals of any team (280) and the most points (1,889)
  • Ranked 5th on scoring shots per game (25.7)
  • Ranked last on opponent conversion rate (57.3%)
  • Ranked 5th on Q3 performances (58% of quarters won, 100 percentage)
Port Adelaide
  • Kicked the 2nd fewest number of goals of any team (201) and the 2nd fewest total points (1,397)
  • Ranked 15th on scoring shots per game (22.2)
  • Ranked 15th on Q2 performances (33% of quarters won, 79 percentage)
Richmond
  • Kicked the fewest goals of any team (195) and the fewest total points (1,361)
  • Have the worst percentage of any team (73.7)
  • Better record for 2nd half of season than the nine teams above them on the ladder
  • Ranked 4th on opponent conversion rate (50.9%)
  • Ranked last on scoring shots per game (21.4) and 2nd last on opponent scoring shots per game (28.9)
  • Ranked 16th on Q2 performances (28% of quarters won, 76 percentage) and 15th on Q3 performances (28% of quarters won, 67 percentage)
Brisbane Lions
  • Only team not to have recorded a win in the 2nd half of the season
  • Ranked 6th on opponent conversion rate (51.4%)
  • Have the worst Q1 performance of any team (25% of quarters won, 60 percentage)
West Coast
  • Kicked within 5 goals of the 7 teams above them on the ladder excluding Essendon
  • Conceded the most goals of any team (283) and the most points (1,947)
  • Ranked 8th on conversion rate (51.4%) and 9th on opponent conversion rate (53.2%)
  • Ranked 7th on Q2 performances (56% of quarters won, 103 percentage), but last on Q3 performances (25% of quarters won, 72 percentage) and Q4 performances (22% of quarters won, 61 percentage)


MAFL 2010 : Team Dashboard for Round 12

Here's the week's MAFL Team Dashboard.

This week I thought we'd take a look at the correlations between team ladder position and the performance statistics in the Scoring Shot Data and Quarter-By-Quarter Performance sections of the Dashboard.

Here's the summary:

Scoring Shots

  • The (rank) correlation between Scoring Shots For (measure A) and Ladder Position is +0.75. It would be much higher but for the effect of St Kilda who are 12th on this measure but 2nd on the ladder.
  • The (rank) correlation between Scoring Shots Against (measure B) and Ladder Position is +0.84.
  • The (rank) correlation between the Scoring Shot Differential (measure C) and Ladder Position is +0.98.
  • Creating and preventing scoring shots seem to be of roughly equal importance in generating success so far this season.

Scoring Shot Conversion

  • The (rank) correlation between Own Conversion Rate (measure D) and Ladder Position is +0.72. Collingwood, who are 3rd on the ladder but an astonishing 14th on this measure, drag this correlation down. The Pies could surely have had no better reminder of the importance of converting opportunities than that provided by their 9.22 performance on the weekend, which cost them 2, and almost 4, competition points.
  • The (rank) correlation between Opponents' Conversion Rate (measure E) and Ladder Position is +0.08.
  • The (rank) correlation between Conversion Rate Differential (measure F) and Ladder Position is +0.41.
  • Clearly, this season, success has been far more about converting opportunities than it has been about preventing opponents from doing the same.

Quarter-By-Quarter Performance

  • The (rank) correlation between ranking on Q1 performance and Ladder Position is +0.79.
  • The (rank) correlation between ranking on Q2 performance and Ladder Position is +0.58, dragged down by St Kilda, who are 2nd on the ladder but 14th on Q2 performances, having won just 4 from 12 second terms.
  • The (rank) correlation between ranking on Q3 performance and Ladder Position is +0.69
  • The (rank) correlation between ranking on Q4 performance and Ladder Position is +0.65. Two teams have depressed this correlation, Collingwood and Hawthorn, the former being 3rd on the ladder but 11th on Q4 performances, and the latter being 8th on the ladder but 16th on Q4 performances.
  • Unusually, it's been Q1 performances that have been most indicative of a game's outcome this season. Winning teams have won first quarters in 71 of the 96 games played so far this season (and they've drawn 2 more), which is higher than any other quarter.
    To put this in some historical context, last season, winning teams won just 68.9% of games (ignoring draws). This season they've won 75.8% (ignoring the draw).

MAFL 2010 : Team Dashboard for Round 11

Here's the week's MAFL Team Dashboard.

A few things to note in this data:

  • Collingwood, despite being placed second on the ladder, have the second-worst opponent conversion rate (56.4%) and a relatively poor record in final terms (which was starkly in evidence on Sunday night)
  • Hawthorn are in the eight at least partly because they've prevented their opponents from converting opportunities in front of goal. They're struggling in the second half of games, particularly in final terms where they have a 1-10 record.
  • St Kilda, Essendon and Fremantle are all allowing their opponents to convert too many of their opportunities. Essendon's struggles in first and last terms, Fremantle in third terms, and St Kilda in second terms.
  • Relative to their respective ladder positions, Melbourne and Richmond are ranked highly on opponent conversion rate.
  • Melbourne performs significantly better is third terms.
  • Port Adelaide has mastered the art of the whirlwind finish, winning almost two-thirds of the final terms it's played. This hasn't been enough in 6 games out of 11 however.
  • The Lions continue to pair lousy first halves with stunning second halves. The round just finished provided an excellent example of this, as the Lions were outscored 10 goals to 5 by the Roos in the first half of their game, before kicking 8 goals to 2 in the second half.
  • West Coast performs relatively poorly in second halves.
  • The Bulldogs are the best in the league for second terms.