MAFL 2011 : Team Dashboard for Round 3
/It's still far too early to be reading much into the MAFL Team Dashboard numbers, but I will highlight a few things:
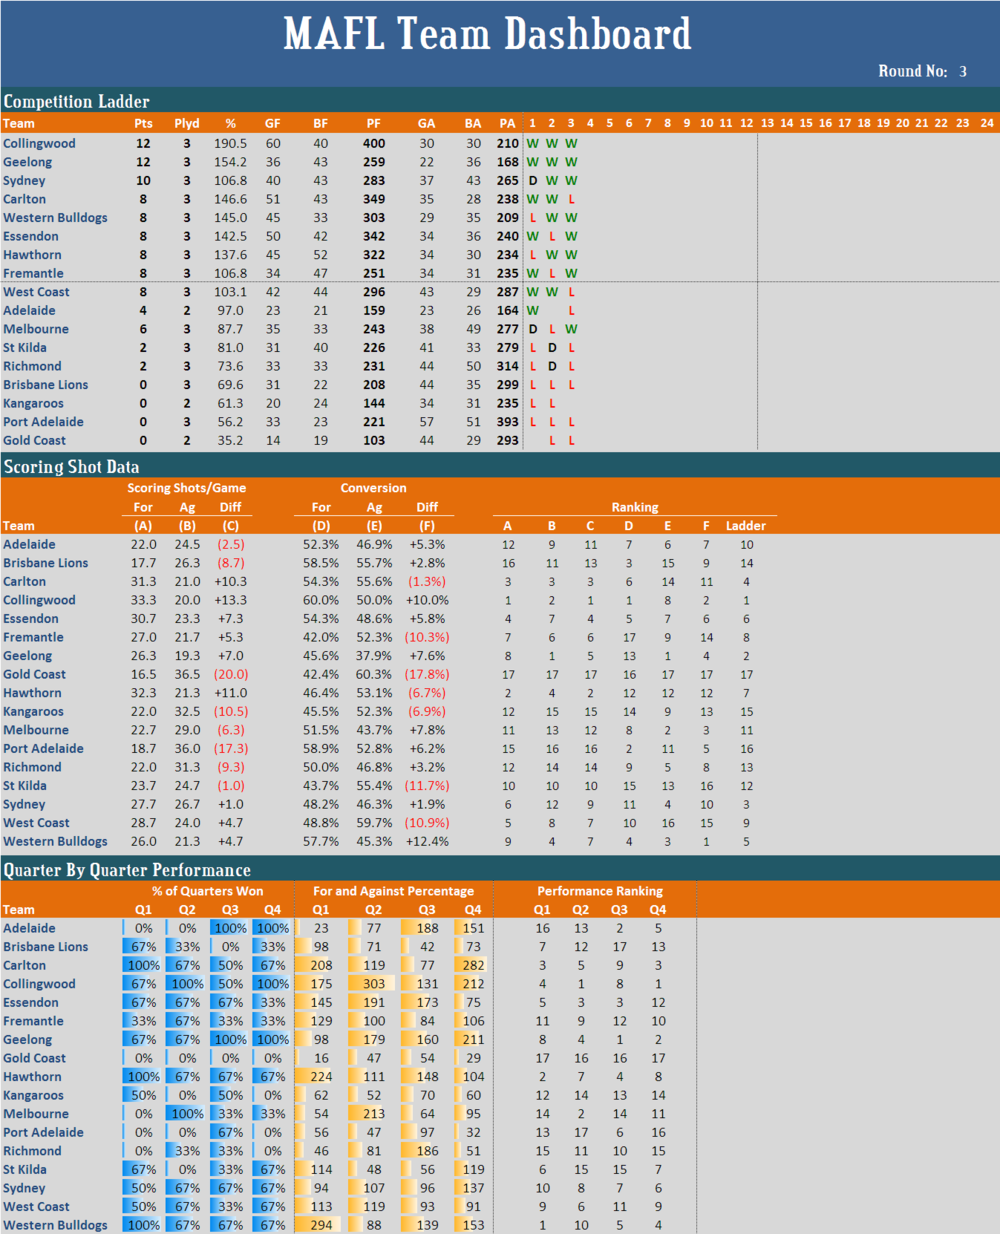
- The nine teams highest on the ladder all have percentages above 100, but only four of them have converted at better than 50%. Of the remaining eight teams, four of them have converted at better than 50%, and one more has converted at exactly 50%. The early signs are, therefore, that this season's going to be more about creating scoring opportunities than converting them (to a point).
- Collingwood are ranked 1st or 2nd on all Scoring Shot metrics except Opponent Conversion for which they rank 8th having allowed their opponents to convert exactly 50% of their scoring shots into goals.
- Carlton, Fremantle, Hawthorn and West Coast are other higher-ranked teams with relatively poor Opponent Conversion rates.
- Geelong's problem is, instead, Own Conversion on which it ranks 13th having converted at just under 46%. Sydney and Hawthorn are other higher-ranked teams with a similar problem.
- Adelaide's won both of their 3rd and 4th quarters this season, Carlton's won every 1st quarter this season, Collingwood's won every 2nd and 4th quarter, Geelong's won every 3rd and 4th quarter, Melbourne's lost every 1st and won every 2nd quarter, and the Dogs have won every 1st quarter. Gold Coast are yet to win a single quarter.
- Collingwood has a percentage of over 100 for all four quarters and has outscored their opponents in 2nd quarters by 3:1. Hawthorn also has a percentage of over 100 for all four quarters, and Geelong very nearly does too.
- Four teams have been, in aggregate, outscored in every quarter: the Lions, Gold Coast (and how), the Roos, and Port Adelaide.