A Well-Calibrated Model
/It's nice to come up with a new twist on an old idea.
This year, in reviewing the relative advantages and disadvantages conferred on each team by the draw, I want to do it a little differently. Specifically, I want to estimate these effects by measuring the proportion of games that I expect each team will win given their actual draw compared to the proportion I'd expect them to win if they played every team twice (yes, that hoary old chestnut in a different guise - that isn't the 'new' bit).
Now to do this I need a simple model to estimate a team's chances of winning a specific contest, and I've decided to use only each team's ratings and the interstate status of that contest for this purpose.
In the past I might have used the binary logit formulation by turning the match results into 0/1 variables (deleting games that finished as a draw) and then estimating the Maximum Likelihood Estimators for the coefficients a, b, c and d in:
Pr(Home Team Wins) = logistic(a + b*Home Team MARS Rating + c*Away Team MARS Rating + d*Interstate Status), and so.
Alternatively, if I wanted to be more flexible about the appropriate functional form for the relationship between the selected variables and the probability that the Home team wins I'd use Nutonian - version II of the Eureqa program I've spoken about in the past - with the Target Expression:
Result = f(a + b*Home Team MARS Rating + c*Away Team MARS Rating + d*Interstate Status)
where Result is the 0/1 variable denoting the game outcome from a Home team perspective that I mentioned earlier, though here it can also be allowed to take on the value 0.5 for a draw.
With this formulation, Nutonian might be asked to choose f, a, b, c and d to minimise the absolute or the squared difference between Result and f, evaluated with the selected coefficients and given values for the team Ratings and Interstate Status in each game.
(There are other functions of Result and f that I could choose to maximise or minimise, but the two I've mentioned here are the objective functions I'd most often choose.)
Both of these approaches are sound and have cranked out good models for us in the past, but this time I decided I wanted to construct a model that was purpose-built to be well-calibrated in a Probability Score sense - that is, that tended to predict x% winning chances for teams that win x% of the time.
A little thinking (ok, a lot) made me realise that I could use one of the more advanced features of Nutonian to do this. In particular I realised I could use the advanced Target Expression shown below.
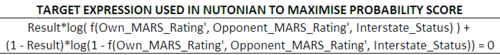
With the Target Expression specified in this way, Nutonian knows that it's to optimise the function f, both by choosing its functional form and by entering the three specified variables in an optimal way. The variable Result is again treated as a constant vector. With formulations of this type, the optimisation that Nutonian attempts is the minimisation of the expression on the left of the equals sign. That's appropriate here as this expression decreases the higher the probability assigned to the winning team.
As always, we want to use a training and a holdout sample to prevent overfitting. Often I've used all but the most recent season's data as the training sample and then the most recent season as the holdout. But, as I've said elsewhere, I think last season was quantitatively different from those that went before it, so the holdout sample I've used for the current modelling exercise was randomly plucked from all 12 seasons such that both my training and my holdout samples comprised about 50% of the games from each season.
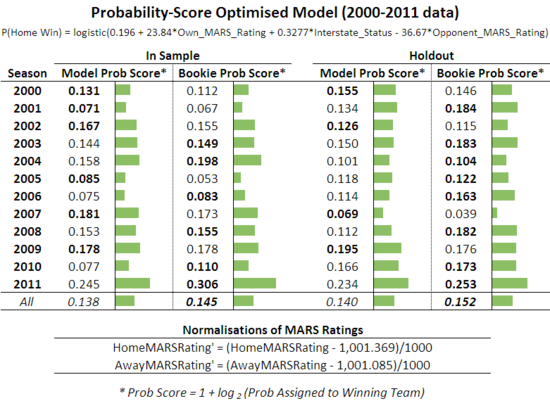
The probability score results of the optimised model are summarised in the following table:

There are a few technical things to note about the approach here:
- the Home Team MARS Rating and the Away Team MARS Rating have been normalised by subtracting the relevant Rating average across all 12 seasons and then dividing the result by 1000
- the probability score formulation used was as per the asterisked footnote. This is the same formulation as we used to measure the probability score performance of selected models last year
Turning then to the results, it's those for the holdout sample that matter most.
We find that the fitted model is better calibrated than the TAB Sportsbet Bookmaker in 7 of the 12 seasons, though very narrowly less well-calibrated across the 12 seasons considered together. That's a very pleasing result for such a simple model across such a large expanse of time, especially for a model that's not using bookmaker probabilities as an input. An average probability score of over 0.15 per game across 12 seasons is very acceptable.
The fitted model suggests that the best estimate of the Home team's victory probability is about 3.1% plus a logistic involving only the Ratings of the two teams and the Interstate Status of the contest. Here's a table showing the probabilities that this model assigns to different contests (the top block applies to contests where the Home and Away teams are from the same State and the bottom block to where the Home team State is different from the Away team State):

Referring to the previous table for a moment, note how aberrant last season was in terms of the probability scores achieved both by the TAB Sportsbet bookmaker and the fitted model; yet more evidence of how different was season 2011, not least in terms of its relatively predictability.
Though the model wasn't built with the intention of using it as a Fund algorithm, it's nonetheless interesting to see how it would have fared if used to wager. Recall that we've found in previous analyses that a model's probability score is an indicator of its likely profitability in use, so we might expect the fitted model here to perform reasonably well.

In short, it does.
The leftmost columns pertain to the ROI that could have been achieved by wagering on the fitted probabilities only in those games where a Home team wager was indicated given the available bookmaker prices. The middle columns provide the same results but only for those games where an Away team wager was indicated, and the rightmost columns represent the aggregate performances for wagering on either the Home or the Away team (or neither) as indicated by the model.
Here too it's the Holdout results that are most salient. They show that, using the fitted model and wagering only on Home teams, an ROI of 7.4% would have been achieved across the 12 seasons, with profit in 8 seasons and losses in 4.
Wagering on Away teams would also have been profitable across the 12 seasons, though only just and with losses in 6 seasons, some substantial, and with profits in the remaining 6, most dramatically in 2011.
Interestingly, in those seasons where wagering on Home teams was a loss-making endeavour, wagering on Away teams was unprofitable too. So, we have here yet another model where Home team only wagering seems to be optimal.
Okay, so we've built the model, now we need to use it for its stated purpose: assessing how cruel or kind the draw's been to each team. I've done that over on the Wagers & Tips blog.
UPDATE: It turns out that, due to a small software glitch, some of the data in the holdout sample was able to bleed into the training sample. The result, as you might expect, was to inflate the holdout performance of the model. That glitch has now been remedied and I've rerun the modelling-building using the same process.
Here, firstly, is the updated chart of the probability scores.
For the holdout sample only the new results for 2003 and 2006 are superior to the old ones, and the model now outperforms the TAB bookmaker in only four, not seven seasons. Still, overall, the model is only slightly inferior to the bookie.

For completeness, here are the wagering results for this new model:
Not surprisingly, the generally lower probability scores translate into generally lower returns in the holdout games. When wagering on the Home team, only the performances in 2002 and 2007 improve with new model, and when wagering on the Away team, only the performances in 2000, 2003 and 2009 are superior, the latter two only barely. Overall, wagering on the Home team or the Away team would have been less profitable using this new model.
Lastly, note that I haven't rerun the draw analysis I performed on this blog. My reasoning is that there's nothing especially egregious about modelling the effects of the draw using a superior model, albeit one that might be a tad overfitted.
