2025 : Simulating the Final Ladder After R23
/This year’s post Round 23 simulations suggest that the teams can be roughly grouped as below:
(For anyone who is curious about the precise methodology I’ve employed, see this blog post over on the General Probability and Statistics journal)
Adelaide: certain of being finalists; certain of Top 4; roughly 90% chances of being Minor Premier
Geelong: certain of being finalists; certain of Top 4; roughly 10% chances of being Minor Premier
Brisbane Lions, Collingwood, and Gold Coast: certain or near-certain of being finalists; 50-65% chances of Top 4; <1% chances of being Minor Premier
Hawthorn and GWS: certain of being finalists; 10-30% chances of Top 4; <1% chances of being Minor Premier
Western Bulldogs: about 85% chance of being finalists; 1% chances of Top 4; <1% chances of being Minor Premier
Fremantle: around 15% chance of being finalists; <1% chances of Top 4; <1% chances of being Minor Premier
Sydney, St Kilda, Carlton, Port Adelaide, Melbourne, Essendon, North Melbourne, Richmond, and West Coast: <1% chances of being finalists; <1% chance of Top 4; <1% chance of being Minor Premier
LADDER FINISHES
Looking at the changes in Finals chances, we have as the most dramatic:
INCREASES
Brisbane: 15% point increase (to 100%) of finishing Top 8 and 35% point increase (to 64%) of finishing Top 4
GWS: 27% point increase (to 100%) of finishing Top 8
Hawthorn: 21% point increase (to 100%) of finishing Top 8 and 11% point increase (to 28%) of finishing Top 4
DECREASES
Fremantle: 60% point decrease (to 17%) of finishing Top 8 and 22% point decrease (to <1%) of finishing Top 4
Gold Coast: 36% point decrease (to 49%) of finishing Top 4
FORECASTS FOR THE FINALS
Looking next at Finals prospects, we have:
Flag favouritism is currently, in order (with fair prices shown in brackets):
Geelong (about $2.70)
Adelaide (about $5)
Hawthorn (about $9.10)
Brisbane Lions and Western Bulldogs (about $11.15)
Gold Coast (about $10)
Collingwood (about $12.50)
We can break down those numbers for each team now into which team they lose to in order to bow out in a particular week of the Finals.
Lastly, we can also take a look at likely Grand Final pairings and who fares best in each pairing.
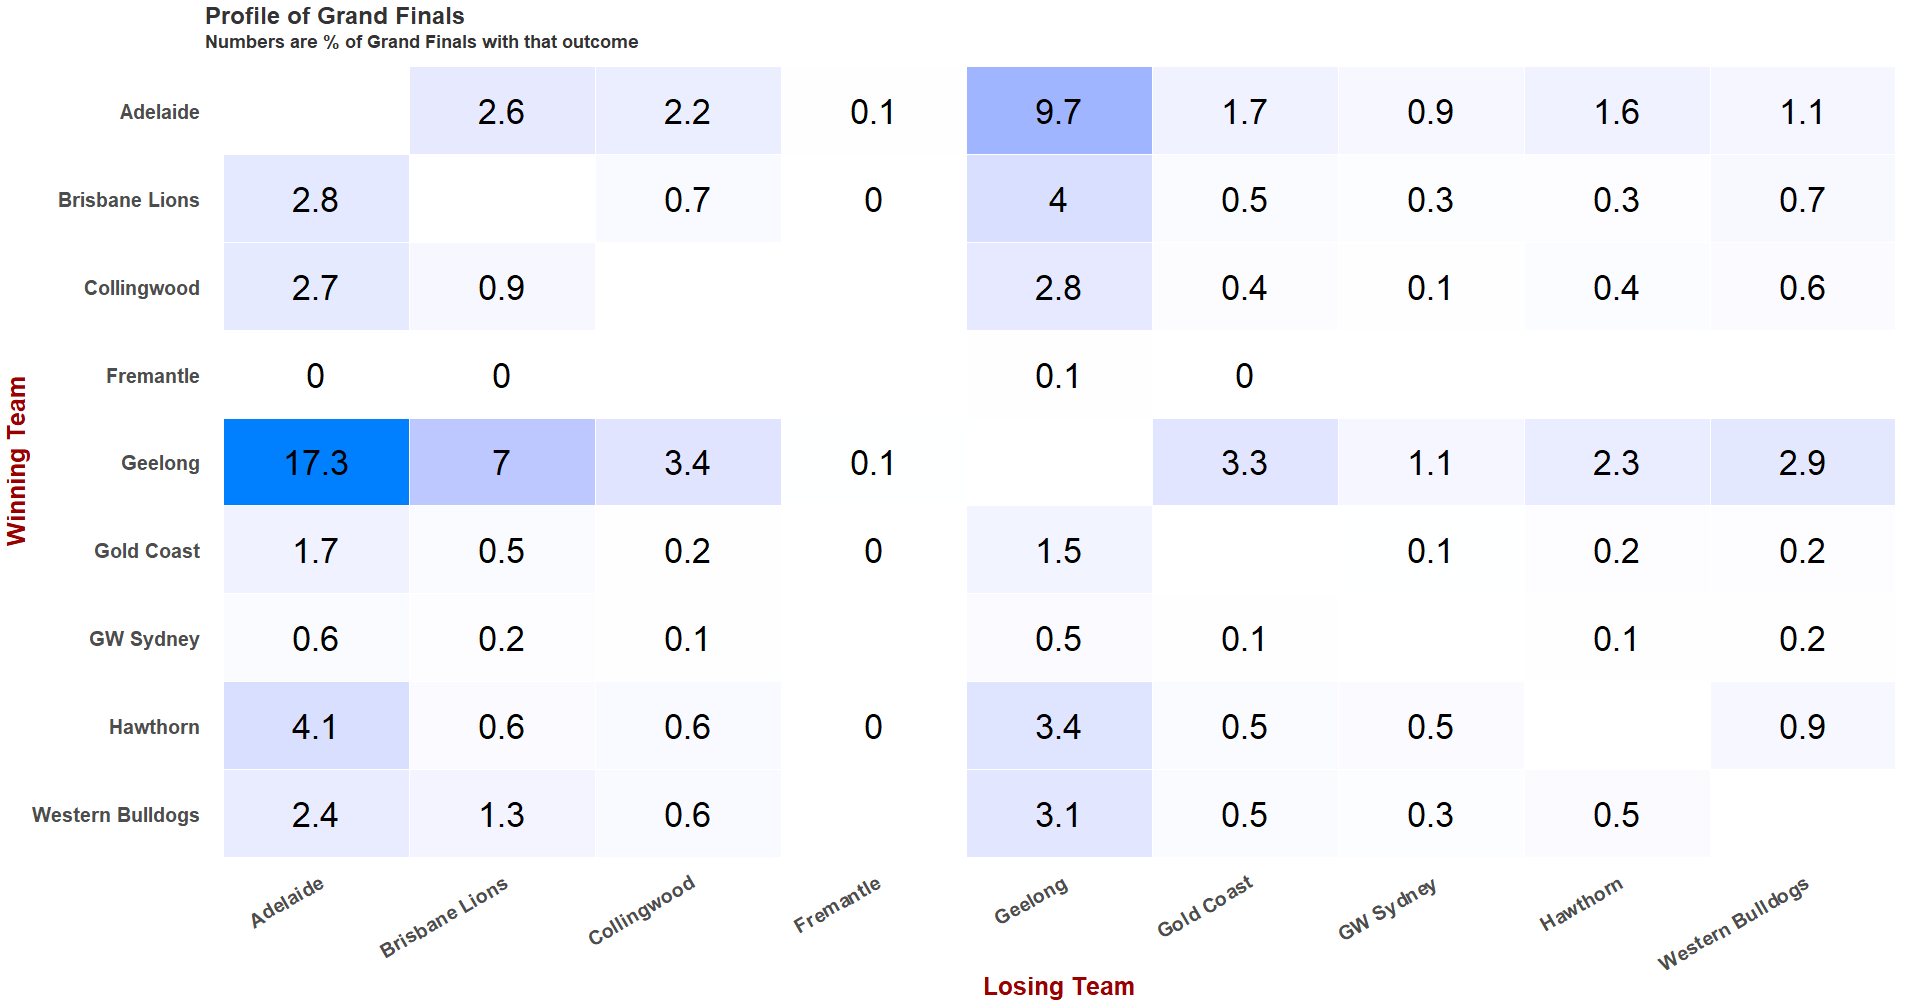
The most common pairings are
Geelong / Adelaide, which accounts for about 27% of all Grand Finals. Geelong wins about 65% of those.
Geelong / Brisbane Lions: about 11% of GFs, Geelong wins about 65%
Geelong / Collingwood: about 6% of GFs, Geelong wins about 55%
Western Bulldogs / Geelong: about 6% of GFs, Western Bulldogs wins just over half
Hawthorn / Geelong: about 6% of GFs, Hawthorn wins about 60%
Hawthorn / Adelaide: about 6% of GFs, Hawthorn wins about 70%
Adelaide / Brisbane Lions: about 5% of GFs, Brisbane Lions wins just over half
Collingwood / Adelaide: about 5% of GFs, Collingwood wins about 55%
Geelong / Gold Coast: about 5% of GFs, Geelong wins a little less than 70%
COMBINATIONS AND PERMUTATIONS IN TOP X TEAMS
In the latest 10,000 simulation replicates there were:
864 different Top 18s
355 different Top 8s (which contain 3 unique sets of 8 teams in some order)
42 different Top 4s (which contain 13 unique sets of 4 teams in some order)
LIKELIHOOD OF AN ALL NON-VICTORIAN TEAM gRAND fINAL
After last week’s results, there was a large decrease in the probability that the Grand Final will involve two non-Victorian teams this year.
The new numbers suggest that there’s now about a 2-in-9 chance that both of the Grand Finalists will be from Victoria, but about another 2-in-3 chance that just one of the Grand Finalists will be a Victorian team.
That leaves about 1-in-8 Grand Finals where there is no Victorian representation. If there is to be no Victorian team involvement, by far the most likely State matchup is Queensland v South Australia.
LIKELY IMPORTANCE OF PERCENTAGE
As the final table for this week, we’ll use the simulations to investigate the estimated likelihood that any given pair of ladder positions will be determined after Round 24 based on percentage.
So, our current estimates are:
There’s now about a 5-in-6 chance that 8th will be decided on percentages (up to 83% from 48%)
There’s now about a 5-in-6 chance that 4th will be decided on percentages (up to 82% from 58%)
There’s now only about a 1-in-8 chance that 1st will be decided on percentages (down to 12% from 29%)
