AFLW 2026- Round 9 Results - And Again
/WoSHBODS tipped 7 from 9 winners this week and the bookmakers only 6, but remains 5 tips behind them both across the whole season.
Its Margin MAE was 21.6 points per game, compared to 18.9 and 19.2 for the two bookmakers, and its Total MAE was 14.6 points per game, compared to 13.2 and 13.1 for the two bookmakers.
WoSHBODS’ season-long Margin MAE is now 19.1 points per game, compared to 18 for the two bookmakers.
Lastly, WoSHBODS’ LPS of +2.1 bits compares to +2.2 and +2.1 bits for the two bookmakers.
Across the season WoSHBODS is on +14.1 bits to +20 for the bookmakers.
WAGERS
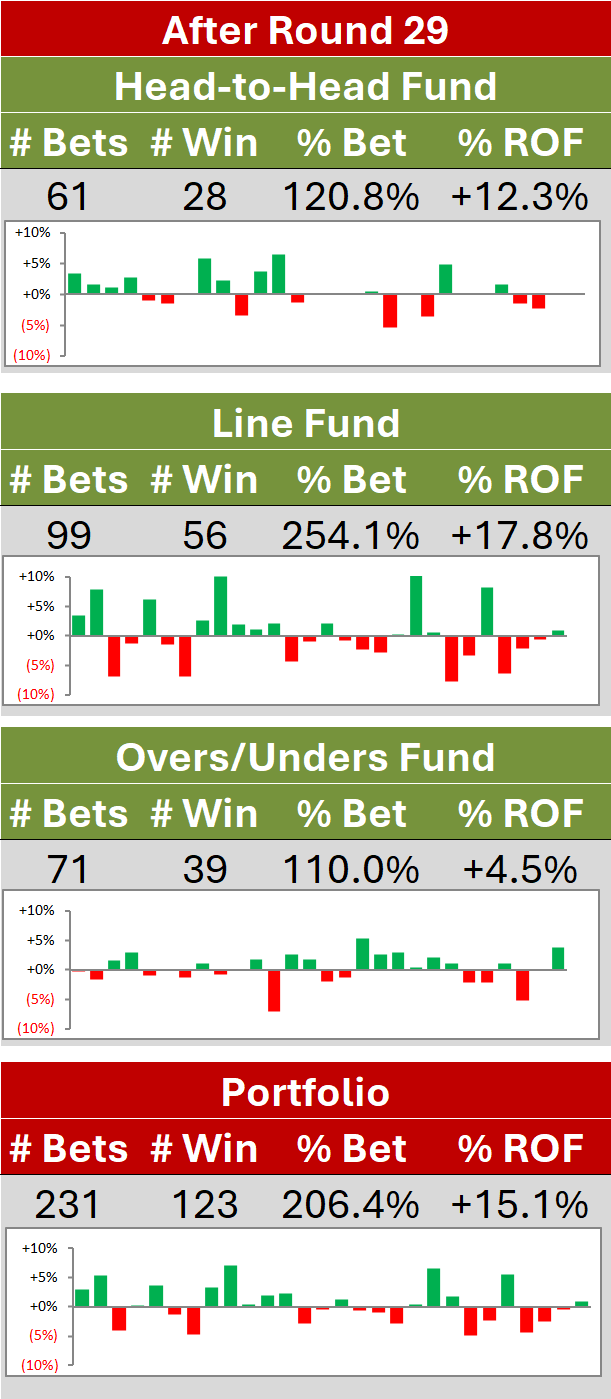
All three Funds made money this week, although none of them a great deal, but enough to lift the Combined Portfolio by just over 1c on the round leaving it now down by just over 5c on the season, that from a -4% ROI on a 1.2 turn.
TEAM MARGIN MAEs
Let’s have a first look for the season at how WoSHBODS has performed on Margin MAEs on a team-by-team basis.
It’s done best on Western Bulldogs games by some distance where it has enjoyed a sub-11 margin MAE. It’s also done relatively well on GWS, Collingwood, and Sydney games.
Games involving Geelong, Brisbane, and Gold Coast have been problematic, with margin MAEs for those games exceeding 4 goals per game.
Ten teams have margin MAEs below the average of 19.1 points per game, and eight teams have margin MAEs above the average.
WoSHBODS has had more difficulty with winning teams than with losing ones, as the top 4 teams on the ladder are all in the worst 7 teams in terms of margin MAE.
TEAM LPS
Let’s also have a look at the team-by-team LPS’ to get a feeling for how accurately WoSHBODS has been assigning probabilities to each team’s chances.
Here we find WoSHBODS doing best with Carlton, St Kilda, Geelong, and Collingwood, and worst with Hawthorn, Gold Coast, Brisbane and West Coast.
Comparing these results to those for Team Margin MAEs we find that:
Collingwood, Western Bulldogs, and Carlton are in the Top 6 on both metrics
Adelaide, Brisbane, Gold Coast, and Hawthorn are in the Bottom 6 on both metrics
Geelong is in the Top 6 on LPS but is last on Margin MAE
Only six teams have contributed negative bits when summed across all nine rounds.
PERFORMANCE BY MARGIN
As one last thing to look at for the first time this week, let’s see how WoSHBODS has performed on depending on the final margin of the game.
We see that the smallest MAEs have come in the games with the narrowest victory margins, with the games most inflating the overall MAE the 10 where the margin has been 8 goals or more.
Conversely, accuracy has been greatest for games with the largest margin and near coin-toss level in games decided by less than 3 goals.
TEAM DASHBOARD
Below is a table recording how the teams rank on various Team Dashboard metrics.
The metrics most rank correlated with ladder position are:
MoS Win Production Function: +0.97
Own Goals per Game: +0.94
Own Points per Game: +0.94
Percentage of Quarters Won: +0.92
Own Scoring Shots per Game: +0.9
Opponent Points per Game: +0.84
Q2 Performances: +0.81
Opponent Goals per Game: +0.8
Opponent Scoring Shots per Game: +0.79
Q4 Performances: +0.77
The metric least rank correlated with ladder position is:
Opponent Scoring Shot Conversion: +0.4
Note that, amongst the teams in the Top 8 on the ladder, only Adelaide is missing (and Sydney added) if we look at the Top 8 on the Win Production Function.
Also, Geelong’s outlying performance on restricting opponent scoring is very evident.
Next come the details of the Team Dashboard in two parts.
In the top part we can see that the Top 9 teams represent 73% of all wins.
We can also see that Geelong has scored an average of almost 11 goals a game and conceded under 7 goals, while Melbourne and North Melbourne have scored about 9 but conceded only about 3-and-a-half to 5. St Kilda has scored just over 3 goals per game and conceded 8-and-a-half.
Looking at the WIn Production Function:
Sydney, Richmond, Port Adelaide, Western Bulldogs, Geelong, and Gold Coast have all won about 1 game more than expected, based on their scoring data
GWS and Brisbane have won about 2 games fewer than expected
In the bottom half we see that:
North Melbourne has won 28 (and drawn 1) of 36 quarters this season. Geelong is next with 25, then Carlton and Gold Coast with 23 wins and 2 draws and Melbourne with 23 wins and 1 draw.
Over the same time period, Collingwood, Essendon and St Kilda have won only 10 quarters.
The teams that have outscored their opponents, on average, in every quarter are Carlton, North Melbourne, and Melbourne. Geelong have done it for Q1 to Q3 but only matched their opponents’ total for Q4. Fremantle have also done it for Q1 to Q3, but fall away dramatically to record a percentage of just 45 in final terms. They have scored only 13% of their total in Q4s and converted at only 38%
Those that have been outscored by their opponents, on average, in every quarter are Essendon, GWS, Richmond, and St Kilda. Brisbane have done the same for Q2 to Q4 but have a 119 percentage for Q1. Collingwood have done the same for Q1 to Q3 but have a 106 percentage for Q4 despite having converted at only 29% in final terms to their opponents’ 60%. What’s helped is that they’re generated 1.7 more scoring shots per game in Q4s than have their opponents.
Western Bulldogs have scored only 13% of their points in Q3s.
Carlton have conceded only 14% of their points in Q1s.
Hawthorn have conceded 39% of their points in Q1s, Collingwood 41% and Western Bulldogs 39% in Q3s.
Collingwood and Western Bulldogs are noticeable for the (presumably) higher quality opportunities they’ve afforded their opponents in second halfs compared to first, as conversion rates jump by 15 to 20 percentage points.