AFLW 2026- Round 10 Results - And Once More
/Once again WoSHBODS tipped 7 from 9 winners this week while the bookmakers tipped only 6, which reduced the season-long deficit to 4 tips.
Its Margin MAE was 22.1 points per game, compared to 22.6 and 22.4 for the two bookmakers, and its Total MAE was 23.6 points per game, compared to 19.7 for the two bookmakers.
WoSHBODS’ season-long Margin MAE is now 19.4 points per game, compared to 18.4 and 18.5 for the two bookmakers.
Lastly, WoSHBODS’ LPS of +2.5 bits compares to +0.8 for the two bookmakers.
Across the season WoSHBODS is on +16.7 bits to +20.8 for the bookmakers.
WAGERS
It was very much a glass half full or half empty kind of wagering round, depending on the games that you choose to focus on.
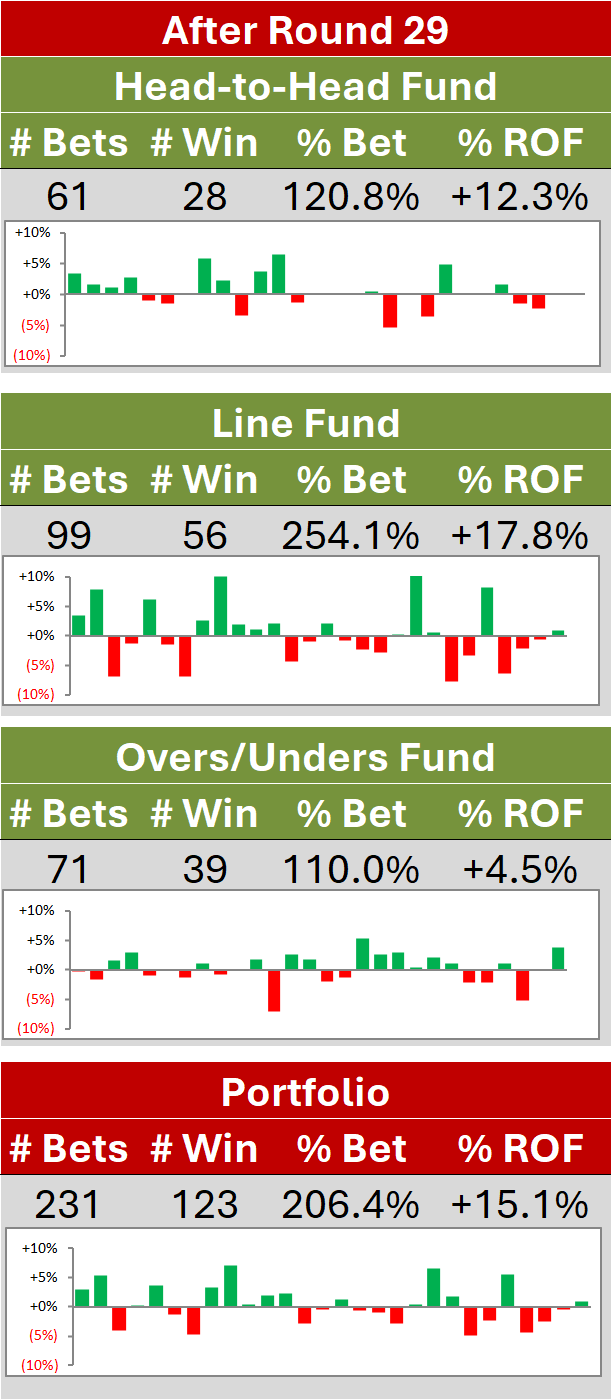
In the end only the Head-to-Head Fund made money this week, but it did so to such an extent that it covered the losses of the other two Funds and still lifted the Combined Portfolio by just over 2c, leaving it now down by just over 3c on the season, that from a -2% ROI on a 1.33 turn.
That’s now four profitable rounds in a row since the horror of Round 6.
TEAM DASHBOARD
Below is a table recording how the teams rank on various Team Dashboard metrics.
The metrics most rank correlated with ladder position are:
MoS Win Production Function: +0.99
Percentage of Quarters Won: +0.96
Own Goals per Game: +0.91
Own Points per Game: +0.90
Own Scoring Shots per Game: +0.89
Opponent Goals per Game: +0.88
Opponent Points per Game: +0.88
Q2 Performances: +0.87
Q4 Performances: +0.82
Opponent Scoring Shots per Game: +0.81
Q1 Performances: +0.76
The metric least rank correlated with ladder position is:
Opponent Scoring Shot Conversion: +0.42
Note that the teams in the Top 8 on the ladder are now the same as the teams in the Top 8 on the Win Production Function.
Next come the details of the Team Dashboard in two parts.
In the top part we can see that the Top 9 teams represent 72% of all wins.
We can also see that Geelong has scored an average of 10.5 goals a game and conceded just over 6 goals, while Melbourne and North Melbourne have scored over 9 but conceded only about 3-and-a-half (North Melbourne) to 5 (Melbourne). St Kilda has scored just over 3.5 goals per game and conceded just under 8-and-a-half.
Looking at the WIn Production Function:
Sydney, Richmond, Port Adelaide, Western Bulldogs, Geelong, and Gold Coast have all won about 1 game more than expected, based on their scoring data
GWS and Brisbane have won about 1 to 1-and-a-half games fewer than expected
In the bottom half we see that:
North Melbourne has won 31 (and drawn 1) of 40 quarters this season. Geelong is next with 29, then Melbourne with 26 wins and 2 draws.
Over the same time period, Collingwood have won only 10 quarters, and Essendon and St Kilda only 11.
The teams that have outscored their opponents, on average, in every quarter are Geelong, North Melbourne, and Melbourne.
Those that have been outscored by their opponents, on average, in every quarter are Collingwood, Essendon, GWS, Richmond, St Kilda, and West Coast.
Western Bulldogs have scored only 14% of their points in Q3s.
Carlton have conceded only 14% of their points in Q1s.
Hawthorn have conceded 37% of their points in Q1s, Collingwood 39% and Western Bulldogs 38% in Q3s.