2025 - Team Ratings After Round 24.1
/MoSSBODS left the team ordering unchanged and MoSHBODS swapped only Essendon and North Melbourne into 16th and 15th respectively, which left MoSSBODS at the end of the home and away season with a Top 3 of Dogs, Cats, and Lions, and MoSHBODS with a Top 3 of Dogs, Cats, and Hawks.
Overall, MoSSBODS now has 12 teams rated as above average and MoSHBODS has 10, with MoSHBODS excluding Sydney and Carlton relative to MoSSBODS.
The correlation between MoSSBODS and MoSHBODS Combined Ratings now stands at +0.99 and, roughly speaking, each team’s Combined MoSHBODS Rating is about 0.96 times its Combined MoSSBODS Rating.
On the Component Ratings, on offence we find MoSSBODS with a Top 3 of Dogs, Cats, and Lions, and MoSHBODS agreeing, while on defence MoSSBODS has a Top 3 of Pies, Hawks, and Crows, and MoSHBODS agrees.
MoSSBODS has 11 teams rated as above average on offence, while MoSHBODS has 10, with the latter dropping Sydney. On defence, MoSSBODS has 10 teams rated as above average on defence, as does MoSHBODS.
Offensive ratings on MoSSBODS currently span a range of 1.69 standard deviations and defensive ratings a range of 1.39 standard deviations. Offensive ratings on MoSHBODS span a range of 1.7 standard deviations and defensive ratings a range of about 1.33 standard deviations.
Standard deviations of offensive ratings across all teams are 0.47 for MoSSBODS and 0.48 for MoSHBODS, and those for defensive ratings 0.42 for MoSSBODS and 0.4 for MoSHBODS
Teams therefore remain more differentiated by their offensive abilities than their defensive abilities,
We can also review the trajectory that each team has followed to arrive at its current MoSHBODS Rating (with thanks to www.footyjumpers.com for the use of their exquisite team guernseys)
On MoSHBODS, 8 teams are rated positively on offence and defence, 6 are rated negatively on both, two are rated positively on offence but negatively on defence, and two more are rated negatively on offence but positively on defence.
The correlation between the teams’ MoSHBODS offensive and defensive Ratings now stands at +0.76.
COMPARATIVE RATINGS OF THE FINALISTS
Now that we know the eight teams progressing to the Finals, let’s take a look at how they compare with finalists from 2000 onwards.
We can see that Geelong is in the Top 5 teams offensively in that period, but relatively lowly ranked on defence. Conversely, Collingwood and Hawthorn are in the top half of teams defensively, but relatively week offensively (especially Collingwood). GWS enters the finals as one of a handful of teams rated negatively defensively.
Next we take the same data that it is in this chart and show it by season (leaving out 2000).
Lastly, we can summarise the Ratings by year to get a measure of the collective strength of each season’s finalists.
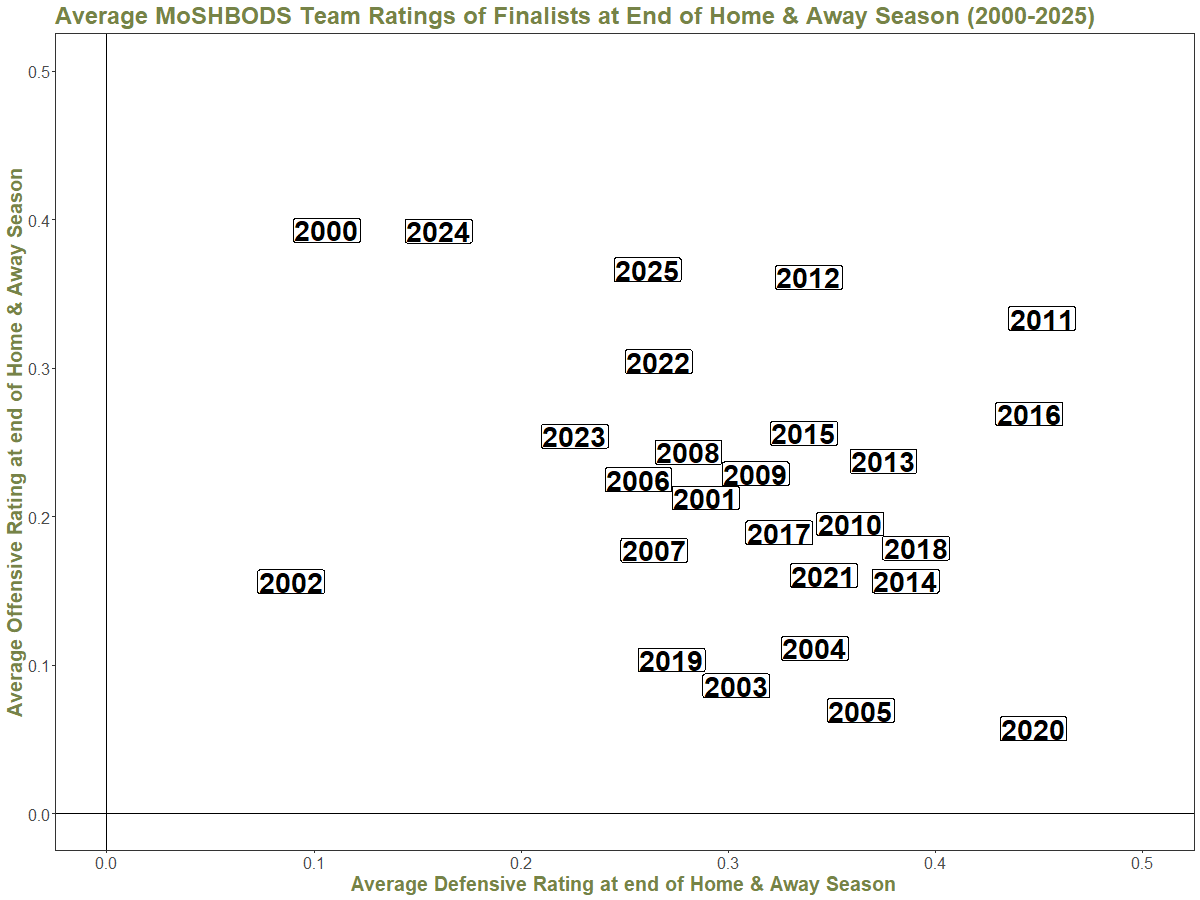
From this we can see that the 2025 finalists are relatively strong offensively, but somewhat weaker defensively.
One last thing to note is that the Western Bulldogs are easily the highest-rated team to miss finals in this period. Their combined Rating was +1.08, and the next highest is North Melbourne’s +0.60 in 2013. The only other teams to miss finals with a +0.5 or higher Combined Rating were St Kilda in 2012 (+0.51) and Port Adelaide in 2015 (+0.50).
Finally, it’s time to take a look at MARS, which also swapped the Roos into 15th ahead of the Dons this week.
There are now 10 teams rated better-than-average by MARS, after which there is a large gap to Carlton’s 994.8.
The Ratings provide something of a natural grouping of the teams:
About 30 points better than an average team: Geelong and Western Bulldogs
About 24 points better than an average team: Adelaide, Hawthorn, and Brisbane Lions
About 16 points better than an average team: GWS, Collingwood, and Gold Coast
About 10 points better than an average team: Fremantle
About an average team: Sydney
About 6 points worse than an average team: Carlton, Melbourne
About 12 points worse than an average team: St Kilda, Port Adelaide
About 32 points worse than an average team: North Melbourne and Essendon
About 42 points worse than an average team: Richmond
About 52 points worse than an average team: West Coast
Looking across the rankings of all three Systems and comparing them with the teams’ competition ladder positions, we find relatively large differences between the teams’ ladder positions and their rating system ordering for:
HIGHER ON LADDER THAN ON RANKING SYSTEMS: None
LOWER ON LADDER THAN ON RANKING SYSTEMS: Western Bulldogs, Hawthorn, and Melbourne (ignoring MARS).
MARS and MoSSBODS this week both provide the most outlying rankings at 9, with MoSHBODS at just 1.
MoSHBODS and MARS agree about the ranking of 8 teams now, MoSSBODS and MARS about 4, and MoSSBODS and MoSHBODS about 9.
Looking finally at the range of rankings that the three Systems have attached to each team we find that GWS has the widest range of rankings at just four spots, and that there are only three other teams whose rankings span more than two spots.
There are also four teams that the Systems unanimously rank: Port Adelaide, Richmond, St Kilda, and West Coast.
Broadly speaking, with no difference in ranking larger than four spots, the three Systems have quite similar views about the relatively strengths of the 18 teams, as shown by the rank correlations below:
MARS with MoSSBODS: +0.942
MARS with MoSHBODS: +0.983
MoSSBODS with MoSHBODS: +0.975
