The 2016 AFL Draw: Difficulty and Distortion

The 2016 AFL Draw, released in late October, once again sees teams playing only 22 of the 34 games required for an all-plays-all, home-and-away competition. In determining which 12 games - 6 at home and 6 away - a given team will miss, the League has in the interests of what it calls "on-field equity" applied a 'weighted rule', which is a mechanism for reducing the average disparity in ability between opponents, using the final ladder positions of 2015 as the measure of that ability.

Read More

Who's Best To Play At Home?

The 2015 AFL Schedule is imbalanced, as have been all AFL schedules since 1987 when the competition expanded to 14 teams,  by which I mean that not every team plays every other team at home and away during the regular season. As many have written, this is not an ideal situation since it distorts the relative opportunities of teams' playing in Finals. 

As we'll see in this blog, teams will have distinct preferences for how that imbalance is reflected in their draw.

Read More

Predicting the Final Ladder

Discussions about the final finishing order of the 18 AFL teams are popular at the moment. In the past few weeks alone I've had an e-mail request for my latest prediction of the final ordering (which I don't have), a request to make regular updates during the season, a link to my earlier post on the teams' 2015 schedule strength turning up in a thread on the bigfooty site about the whole who-finishes-where debate, and a Twitter conversation about just how difficult it is, probabilistically speaking, to assign the correct ladder position to all 18 teams. 

Read More

A First Look at the 2011 Draw

In this blog I'll be reviewing the 2011 draw in terms of Venue Experience, a term that I defined and explored in an earlier blog. A team's Venue Experience for a given game is defined as the number of times that the team has played at that game's venue during the immediately preceding 12 calendar months, including finals.
Read More

The Other AFL Draft

Drafting is a tactic well-known to cyclists and motor-racers and confers an advantage on the drafter by reducing the effort that he or she (or his or her vehicle) needs to expend in order to move. There's a similar concept in round-robin sports where it's called the carry-over effect, which relates to the effect on a team's performance in a particular game that's due to the team its current opponent played in the previous round. Often, for example, it's considered advantageous to play teams the week after they've faced a difficult opponent, the rationale being that they'll have been 'softened up', demoralised and generally made to feel blah by the previous match.
Read More

The Draw's Unbalanced: So What?

In an earlier blog we looked at how each team had fared in the 2010 draw and assessed the relative difficulty of each team's draw by, somewhat crudely, estimating a (weighted) average MARS of the teams they played. From the point of view of the competition ladder, however, what matters is not the differences in the average MARS rating of the teams played, but how these differences, on a game-by-game basis, translate into expected competition points.
Read More

Draw Doesn't Always Mean Equal

The curse of the unbalanced draw remains in the AFL this year and teams will once again finish in ladder positions that they don't deserve. As long-time MAFL readers will know, this is a topic I've returned to on a number of occasions but, in the past, I've not attempted to quantify its effects.

This week, however, a MAFL Investor sent me a copy of a paper that's been prepared by Liam Lenten of the School of Economics and Finance at La Trobe University for a Research Seminar Series to be held later this month and in which he provides a simple methodology for projecting how each team would have fared had they played the full 30-game schedule, facing every other team twice.

For once I'll spare you the details of the calculation and just provide an overview. Put simply, Lenten's method adjusts each team's actual win ratio (the proportion of games that it won across the entire season counting draws as one-half a win) based on the average win ratios of all the teams it met only once. If the teams it met only once were generally weaker teams - that is, teams with low win ratios - then its win ratio will be adjusted upwards to reflect the fact that, had these weaker teams been played a second time, the team whose ratio we're considering might reasonably have expected to win a proportion of them greater than their actual win ratio.

As ever, an example might help. So, here's the detail for last year.

Imbalanced_2008.png

Consider the row for Geelong. In the actual home and away season they won 21 from 22 games, which gives them a win ratio of 95.5%. The teams they played only once - Adelaide, Brisbane Lions, Carlton, Collingwood, Essendon, Hawthorn, St Kilda and the Western Bulldogs - had an average win ratio of 56.0%. Surprisingly, this is the highest average win ratio amongst teams played only once for any of the teams, which means that, in some sense, Geelong had the easiest draw of all the teams. (Although I do again point out that it benefited heavily from not facing itself at all during the season, a circumstance not enjoyed by any other team.)

The relatively high average win ratio of the teams that Geelong met only once serves to depress their adjusted win ratio, moving it to 92.2%, still comfortably the best in the league.

Once the calculations have been completed for all teams we can use the adjusted win ratios to rank them. Comparing this ranking with that of the end of season ladder we find that the ladder's 4th-placed St Kilda swap with the 7th-placed Roos and that the Lions and Carlton are now tied rather than being split by percentages as they were on the actual end of season ladder. So, the only significant difference is that the Saints lose the double chance and the Roos gain it.

If we look instead at the 2007 season, we find that the Lenten method produces much greater change.

Imbalanced_2007.png

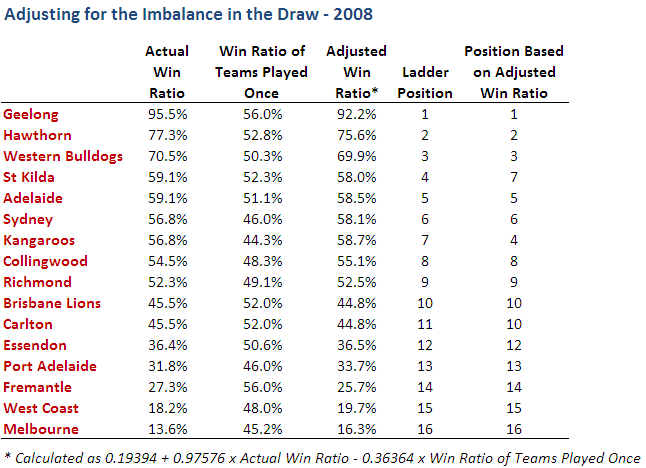
In this case, eight teams' positions change - nine if we count Fremantle's tie with the Lions under the Lenten method. Within the top eight, Port Adelaide and West Coast swap 2nd and 3rd, and Collingwood and Adelaide swap 6th and 8th. In the bottom half of the ladder, Essendon and the Bulldogs swap 12th and 13th, and, perhaps most important of all, the Tigers lose the Spoon and the priority draft pick to the Blues.

In Lenten's paper he looks at the previous 12 seasons and finds that, on average, five to six teams change positions each season. Furthermore, he finds that the temporal biases in the draw have led to particular teams being regularly favoured and others being regularly handicapped. The teams that have, on average, suffered at the hands of the draw have been (in order of most affected to least) Adelaide, West Coast, Richmond, Fremantle, Western Bulldogs, Port Adelaide, Brisbane Lions, Kangaroos, Carlton. The size of these injustices range from an average 1.11% adjustment required to turn Adelaide's actual win ratio into an adjusted win ratio, to just 0.03% for Carlton.

On the other hand, teams that have benefited, on average, from the draw have been (in order of most benefited to least) Hawthorn, St Kilda, Essendon, Geelong, Collingwood, Sydney and Melbourne. Here the average benefits range from 0.94% for Hawthorn to 0.18% for Melbourne.

I don't think that the Lenten work is the last word on the topic of "unbalance", but it does provide a simple and reasonably equitable way of quantitatively dealing with its effects. It does not, however, account for any inter-seasonal variability in team strengths nor, more importantly, for the existence any home ground advantage.

Still, if it adds one more finger to the scales on the side of promoting two full home and away rounds, it can't be a bad thing can it?

Who Fares Best In The Draw?

Well I guess it's about time we had a look at the AFL draw for 2009.

I've summarised it in the following schematic:

Draw_Summary.png

The numbers show how many times a particular matchup occurs at home, away or at a neutral venue in terms of the team shown in the leftmost column. So, for example, looking at the first row, Adelaide play the Lions only once during 2009 and it's an away game for Adelaide.

For the purpose of assessing the relative difficulty of each team's schedule, I'll use the final MARS Ratings for 2008, which were as follows:

Ratings.png

Given those, the table below shows the average MARS Rating of the opponents that each team faces at home, away and at neutral venues.

Strength_of_Schedule.png

So, based solely on average opponent rating, regardless of venue, the Crows have the worst of the 2009 draw. The teams they play only once include five of the bottom six MARS-ranked teams in Brisbane (11th), Richmond (12th), Essendon (14th), West Coast (15th), Melbourne (16th). One mitigating factor for the Crows is that they tend to play stronger teams at home: they have the 2nd toughest home schedule and only the 6th toughest away and neutral-venue schedules.

Melbourne fare next worst in the draw, meeting just once four of the bottom five teams, excluding themselves. They too, however, tend to face stronger teams at home and relatively weaker teams away, though their neutral-venue schedule is also quite tough (St Kilda and Sydney).

Richmond, in contrast, get the best of the draw, avoiding a second contest with six of the top eight teams and playing each of the bottom four teams twice.

St Kilda's draw is the next best and sees them play once only four of the teams in the top eight and play each of the bottom three teams twice.

Looking a little more closely and differentiating home games from away games, we find that the Bulldogs have the toughest home schedule but also the easiest away schedule. Port Adelaide have the easiest home schedule and Sydney have the toughest away schedule.

Generally speaking, last year's finalists have fared well in the draw, with five of them having schedules ranked 10th or lower. Adelaide, Sydney and, to a lesser extent, the Bulldogs are the exceptions. It should be noted that higher-ranked teams always have a relative advantage over other teams in that their schedules exclude games against themselves.