The 2010 Draw
/The AFL's truncated draw will once again this year have a significant bearing on the composition of the final eight and we'll be spending this posting attempting to identify and quantify the implications for each team.
A MARS-based Approach
The MARS Ratings, you might recall, are based on the ELO approach to player ratings used in chess. In the MARS Ratings system a team's rating is varied after each game depending on the difference between the actual outcome and the expected outcome of that game, calculated from the difference in ratings between the participating teams, adjusted for home team status.
Using the MARS Ratings for the teams as at the end of season 2009 as an estimate of team strength, analysis shows that the Saints and the Crows have fared best in the draw and the Dons have fared comfortably worst.
Here's the detail:

To help you to interpret this table, I'll take you through the row for St Kilda. It shows that the Saints play 10 games at home this season and, in those games, face teams with an average rating of 989.7, which is just over 10 points short of the average team's 1,000 point rating. This average rating of 989.7 is the lowest for all teams, hence the ranking of 1 for the Saints in this section.
The Saints also play 12 games away from home, and the average rating of the teams they face in those games is 999.6, which is pretty close to the 1,000 point average and ranks them 7th amongst all teams for games played away.
St Kilda play no games at a neutral venue this season, so the two values under the "Neutral Venue" heading are both blank.
Overall, combining the Home and Away fixtures and weighting each game equally, the average rating of the teams that the Saints face is 995.1. If we weight the Home, Away and Neutral fixtures to reflect the relative benefits of playing at each venue type - weighting home games at 0.9, games at neutral venues 1, and away games at 1.1 - then the weighted average rating of the teams St Kilda faces is 995.6, which is the lowest for any of the teams.
In other words, based on this measure, St Kilda have the easiest draw in the competition. As a consequence, I've put them as the first row in the table.
Looking elsewhere in the table, one thing that stands out for me is the number of teams who face markedly different fixture mixes at home versus away. Geelong, for example, faces an easy home schedule but a much tougher away schedule, as does Richmond.
In contrast, the Bulldogs, West Coast and Sydney face very tough home schedules but far easier away schedules.
The next table provides the detail of each team's draw.

This time I'll walk through the information for Adelaide to explain the table. The row labelled Home provides the list of teams that Adelaide faces at home this season. The columns have been sorted based on the final MARS ratings for 2008, the values of which appear at the top of the relevant column (so, for example, Geelong finished with a MARS Rating of 1045). The colour-coding of these ratings is meant to broadly group the teams into strong (red), average (yellow), somewhat weak (light green) and very weak (dark green).
The second and third rows provide the Crows' away and neutral ground schedules respectively.
At the end of each row the 4 numbers under the coloured boxes summarise Adelaide's draw in terms of the MARS-strengths of the teams. Adelaide plays 3 strong, 3 average, 2 somewhat weak, and 3 very weak teams at home. The Draw Diff data simply repeats the weighted average rating figures from the earlier table and the Rank data is self-explanatory.
So why, for example, is St Kilda's draw so enticing? Well, amongst the 4 highest-ranked teams (excluding themselves) they play 2 of them only once and amongst the 7 lowest-ranked teams they play only 2 of them just once.
Adelaide's draw is also appealing for much the same reasons. They too only play 2 of the top 4 teams (excluding themselves) twice, and they play only 3 of the bottom 7 teams once.
Essendon's misery stems from their facing 4 of the top 5 teams twice yet each of the bottom 5 teams only once.
Using Market Prices
There are measures other than MARS Ratings that could be used to estimate team strength.
One obvious alternative is each team's current Premiership market price, or the probability that this price implies. At the time of writing, the correlation between these probabilities and the MARS Ratings is +0.89, and between the natural log of these probabilities and the MARS Ratings is +0.95, so we shouldn't expect significant changes to our conclusions if we swap market price based probabilities for MARS Ratings in the analysis.
Here's the table of TAB Sportsbet prices as at 25 January and MARS Ratings for each team.
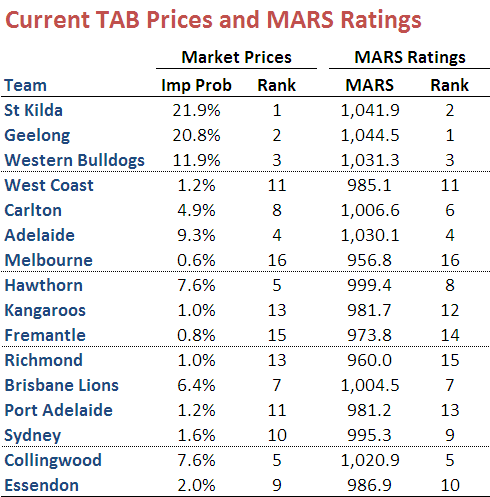
The only team that moves more than 2 ranking places is Hawthorn who climb to 5th in the betting market from 8th in MARS Ratings.
Finally, here's what the analysis of the draw looks like if we use market based probabilities instead of MARS Ratings.

As the last two columns record, the same 6 teams are identified as having the easiest draws, though in a slightly different order. As well, Collingwood and Essendon are still assessed as having the worst draws.
Port Adelaide and Sydney are determined to have a poorer draw than a MARS Ratings based assessment would have it, partly because they both play Hawthorn twice. Adelaide is the only other team to drops more than 2 ranking places in the switch to using market based probabilities. Melbourne is the only team to lift by more than 2 ranking places in this new analysis, jumping from 11th to 7th.
