Correlations in Team Quarter-to-Quarter Scoring
/Once I've taken the trouble to create a dataset, regular readers will know thatI usually like to walk around it a bit to see how it looks from different angles. Today, I'm going to reanalyse the quarter-by-quarter scoring data that I most recently wrote about in a post where I revealed, among other things, that no two VFL/AFL games have ever produced the same scoreline at every change.
I'll be using that same dataset today to investigate the extent to which there is a correlational structure in the quarter-to-quarter scoring of the teams in a football contest. Do, for example, teams that score more goals than an average team in the 1st Quarter tend to score more or fewer goals than an average team in the 2nd Quarter as well? And, to what extent is the above- or below-average scoring of one team correlated with the scoring of its opponent?
THE DATA
I started by including all of the data from 1897 to the end of Round 14 in 2014, from which I produced the following correlation matrix.
(NB: Q1G represents the number of goals scored in Q1, Q1B the number of behinds scored in Q1, and so on for Q2x through Q4x. Own represents a team's own scoring and Opp the scoring of its opponent.)
There's clearly some structure revealed here, with mostly positive correlations in the lefthand block, which are self-correlations for a team's scoring at different points in the same game. For example, the correlation between the number of goals scored by teams in Quarter 1 compared with those same teams in Quarter 3 is +0.283, which means that the shared variability in the scoring in those quarters amounts to about 8% - not massive, but statistically very much non-zero.
The block on the right shows negative correlations along the diagonals, suggesting that a strong showing by a team in one quarter tends to depress the scoring of its opponent in that same quarter. For example, the correlation between a team's Q2 goal scoring and that of its opponent is -0.084.
That all seems quite logical, but the positive correlations between own and opponent scoring in different quarters, when put in the context of the general increase in scoring from the early days of the competition to the present, suggests to me that we might be seeing in the correlation matrix a mixture of the effects of a lack of homogeneity in our dataset and the true correlational structure of scoring. In games played in eras where scoring has been generally higher than average, scoring will tend to be above average in every quarter for both teams, and the opposite will be true in games played in eras where scoring has been generally lower average. This alone could account for the positive correlations between Own and Opponent goal-scoring in the off-diagonals, and the near-zero correlations along the diagonal.
To ameliorate the possible distortions brought about by heterogeneity in the data, I decided then to focus only on the period from 1980 to the present. The correlation matrix for that period is as follows:
The clarity that the decision to narrow the timeframe of the analysis brings to the correlation matrix is remarkable and is a strong reminder to me of the importance of explicitly considering the potential for any significant heterogeneity in the data I'm analysing. Sometimes the assumption of "identically distributed" is important.
With this clarity we can now see the strong correlations between a team's goal-scoring in different quarters. These range from a low of +0.122 between Q1 and Q2 scoring, to a high of +0.187 between Q1 and Q3 scoring. The influence on scoring of prevailing breezes or of any stadium-related effects favouring teams running in one direction rather than the other, are apparent, with Q1/Q3 and Q2/Q4 correlations higher than Q1/Q2, Q2/Q3 and (less so) Q3/Q4 correlations.
A team's own behind-scoring is also correlated across quarters, as is goal- and behind-scoring within a given quarter, but to much smaller extents.
The correlation between Own and Opponent scoring is especially interesting. Approximately speaking, the correlations across quarters are all zero, meaning that a team's scoring in one quarter has very little influence on its opponent's scoring in any other quarter.
A team's scoring does, however, have a depressing influence on an opponent's scoring within the same quarter. For example, the correlation between a team's Q1 goal-scoring and that of its opponent is -0.189. Goal-scoring in a particular quarter also influences an opponent's behind-scoring, to about the same extent - at least in terms of correlations - as the influence on goal-scoring. The sign of these effects is largest in absolute terms in Q3, which is yet more evidence for the common claim that the 3rd Quarter is the "championship quarter".
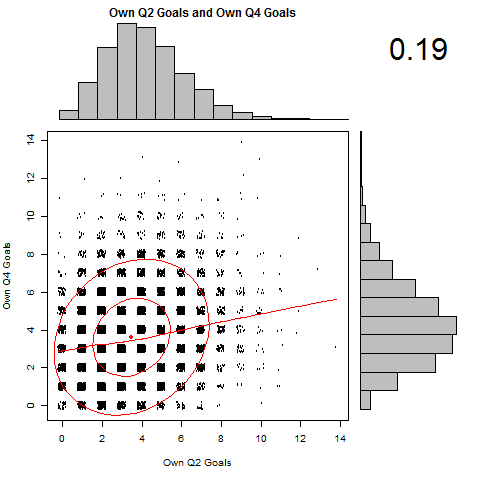
To finish, I thought I'd provide a suite of scatter plots (with histograms in the margins), to give you a sense of the various marginal and bivariate distributions of Own and Opponent goal- and behind-scoring.
(For those who might be curious, I used the scatter.hist function in the psych package of R to produce all the charts.)
The first block of four charts relate to Own goal- and behind-scoring within a particular quarter. In the upper-left, for example, is the data for goal- and behind-scoring in Q1. The red dot shows the average values of behinds scored and goals scored in that quarter by all teams, the ellipses enclose data within 1 (inner) and 2 (outer) standard deviations of the mean, and the red line is a loess fit to the relationship between behind- and goal-scoring. The more circular the ellipses, the smaller the linear correlation between the two scoring aspects being charted.
The remaining charts depict the relationships between Own and Own-versus-Opponent goal-scoring for different combinations of quarters.
This first block contains only self-correlations.
These final blocks contain cross-correlations between Own and Opponent goal-scoring. Here they are for Own Q1 goal-scoring, where we can clearly see the very weak correlations between Own Q1 goal-scoring and Opponent goal-scoring in quarters other than Q1.
Next, the Own Q2 goal-scoring charts where we see the weakness of the correlation with Opponent goal-scoring in Q3 and Q4.
And next, Own Q3 goal-scoring, where we find the highest correlation (with Opponent Q3 goal-scoring) and the lowest (with Opponent Q4 goal-scoring).
And, finally, for Own Q4 goal-scoring, where we see the smallest (in absolute terms) of the correlations between Own and Opponent goal-scoring in the same Quarter.
