Really Simple Margin Predictors
/Sometimes it's interesting to see where an idea takes you.
This blog started out as a wet weekend's musing: how predictive might a margin predictor be if it was based on a single variable?
More specifically, if Eureqa was brought to bear on the data from seasons 2007 to 2012, we allowed it to use for any one model just a single variable derived from Bookmaker prices or from MARS Ratings, if we set the error metric to Eureqa's default, which is Absolute Error using AIC, a metric that values simplicity more highly than most other metrics, and if we chose only those models with a complexity of about 10, what might we create?
I've dubbed the resulting margin predictors the Really Simple Margin Predictors (RSMPs) and they are as follows:
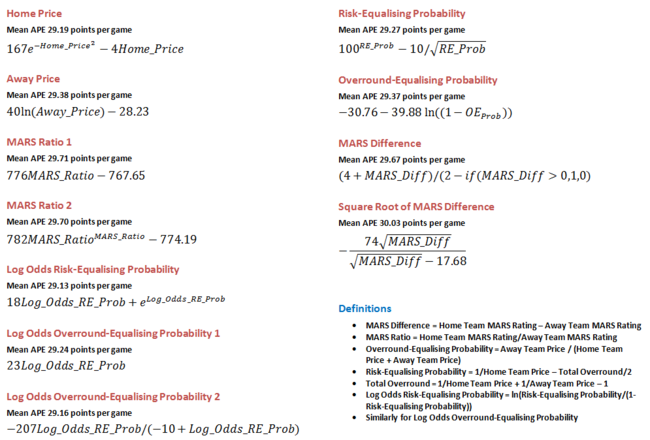
There's no especially startling margin predictor in that lot, though all but the last return a sub-30 MAPE across the six seasons combined, which, given their relative simplicity, is impressive enough. Note that many of them sport integer co-efficients - a consequence of the smaller complexity penalty imposed for the use of such coefficients in a model by Eureqa - which makes their accuracy all the more impressive.
Best amongst them is the RSMP based on the log odds of the Risk-Equalising Home team Probability, which produces an MAPE of 29.13 points per game, only 0.05 points per game worse than the best Margin Predictor I've found to date.
(The MARS Difference RSMP has a slightly odd formula: it predicts the final margin for the Home team will be 4 plus the MARS Rating difference all divided by 1 if the Home team has the higher Rating, or all divided by 2 if it has the lower Rating. That's a quintessentially really simple Really Simple Margin Predictor.)
What's most amazing about the RSMPs though - and which is not something I started out even considering - is how well they work as an ensemble.
This is a topic that I've addressed previously on MAFL, both theoretically and empirically, and a number of our existing Margin Predictors are ensemble models, but it's been my general experience when attempting to build ensembles for MAFL that a single superior predictor emerges and that combining it with one or more other predictors results in an inferior predictor. My intuition has been to put this down to the high levels of correlation between the underlying predictors, which results in their combinations containing little more information that any one of them contains alone, leaving what sets them apart to be largely how well they use that common bucket of information. In that environment, ensemble forecasting is a pathway to mediocrity.
Here however, when you create a simple average of the margin predictions of these 11 RSMPs, you create an ensemble that:
- Has an all-season MAPE of 29.00 points per game.
- Ranks no worse than 4th in any single season in terms of MAPE amongst the RSMPs taken individually, except in 2010 when it finishes 6th (and just 0.11 points per game from 2nd).
- Provides predictions that are within one straight goal of the final result 14% of the time, within 2 straight goals 27% of the time, and within 4 straight goals 50% of the time. Only 25% of the time does it produce a prediction that is in error by more than 7 goals.
By almost any criterion, that's an impressive predictive performance. By combining the 11 RSMPs in the simplest way imaginable we knock 0.13 points per game from the best MAPE for any single RSMP.
As I alluded to indirectly just a moment ago, typically, well-performed ensembles will draw upon base predictors that are independent, or nearly so, in terms of the information that they encapsulate in order to produce predictions. Whilst some RSMPs have potential for independence - the Bookmaker's probabilities, for example, need not necessarily bear any similarity to the Ratings of MARS - the linear correlations amongst them seem likely to be high.
As, indeed, they are:
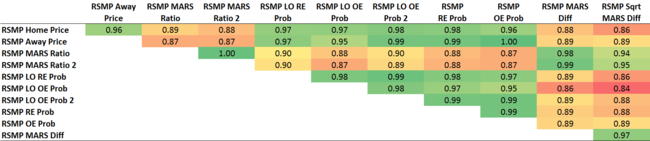 The smallest correlation is +0.84 and the largest +0.99 but, despite the lack of apparent diversity, the whole - well, the average actually - is demonstrably greater than the sum of its parts.
You'll notice that the RSMPs based on MARS Difference are generally less-highly correlated than the other predictors. For the RSMP using the square root of the MARS Difference this lack of correlation comes with a lack of predictive ability, its MAPE the only one in the ensemble above 30 points per game, but the RSMP that uses MARS Difference untransformed finesses the art of being less-correlated while still turning in an MAPE of 29.67 points per game.
No surprise then that a weighted ensemble which includes a hefty dose of the MARS Difference RSMP and an even heftier dose of one of the better-performed RSMPs that is also less-correlated with this RSMP - the Home Price RSMP - performs even better that the ensemble that weights each RSMP equally.
Specifically, an ensemble with the following weights:
- 40% RSMP Home Price
- 25% RSMP MARS Difference
- 10% RSMP MARS Ratio 2
- 10% RSMP Log-Odds Risk-Equalising Probability
- 10% RSMP Risk-Equalising Probability
- 5% RSMP Log-Odds Overround-Equalising Probability
... has an MAPE of 28.92 points per game and is superior to the equally-weighted ensemble in every season except 2011.
So just what do you call an ensemble of Really Simple Margin Predictors? The Slightly Complex Really Simple Margin Predictor Ensemble?
