Setting an Initial Rating for GWS
/Last season I set Gold Coast's initial MARS Rating to the all-team average of 1,000 and they reeled off 70 point or greater losses in each of their first three outings, making a mockery of that Rating. Keen to avoid repeating the mistake with GWS this year, I've been mulling over my analytic options.
Firstly, let's revisit the Gold Coast Suns of 2011 and ask: in retrospect, is there a way to come up with a better Rating for them in the early rounds of 2011? Well the damning evidence that their 1,000 Rating was too high came from their early-season results, so perhaps we can construct a model to link a team's Ratings to its expected results, then use that model to reverse-engineer a team's Ratings based on its results.
But how might we avoid the apparent circularity in that approach when we're suggesting that early-season MARS Ratings might be inaccurate? How about we construct a model fitting late-season game margins to team Ratings, the logic being that, at this point in the season, MARS Ratings are likely to be better reflections of each team's true abilities.
Fitting a model to the results for Rounds 16 and later, including Finals, for seasons 2000 to 2011, yields the following (courtesy of Eureqa and an hour or so):
Expected Margin for Home Team = 2.929 + 8.36*Interstate_Status + 0.6818*Ratings_Difference
As model's go, this isn't too bad: its MAPE is a bit over 30 points per game.
It suggests that, for example, a game played in the home state of the Away team (or, less commonly, in the home state of neither the Home nor the Away team) where the Home team was Rated 10 points higher than the Away team would have an Expected Home Team Margin of 2.929 + 0.6818*10, or 9.7 points.
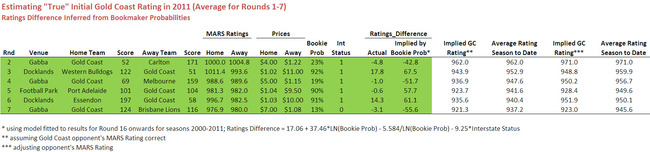
Applying that model to the first 7 rounds of the 2011 season allows us, firstly, to come up with an estimate of Gold Coast's "true" MARS Rating given the actual margin that was recorded in each of their games, assuming that the MARS Rating of their opponents was correct. Those numbers appear in the 4th-last column below.

So, for example, the Gold Coast's loss to Carlton in Round 2 by 119 points suggests that their Rating should have been 813.7 and not 1,000, since -119 = 2.929 + 8.36*1 + 0.6818*(813.7 - 1,004.8).
Similar calculations for each of the Suns' first 6 games yields the results you see in the table. A simple average of these suggests that the Suns' results are consistent with a MARS Rating of about 896.
But, if the Suns' early-season Ratings were wrong, so too might other teams' have been. So, let's apply this same approach to all other games from Rounds 1 through 7 and estimate the average implied Ratings difference for each, then average these for every team. That gives us the following:

The first column of data provides the average implied Ratings Difference for each team across the first 7 rounds. So, for example, based on the margins from Adelaide's games, they were on average 31.4 Ratings Points weaker than their opposition. The next column shows that, based on MARS Ratings, they were apparently 2.1 Ratings Points stronger than their opponents. That's about a 33.5 Ratings Point difference.
Now, across those first 7 rounds, Adelaide were on average MARS Rated at 999.7. Applying the 33.5 Rating Point adjustment - a deduction in the Crows' case - suggests they should have had an average Rating of 966.2 instead. Their Implied "True" Rating is thus 966.2.
If then, instead of using each team's actual MARS Rating at the time they played the Gold Coast, we use their Implied "True" Rating from the table above, we obtain a slightly different assessment of the Gold Coast's ability. That view is shown in the rightmost two columns of the first table. Averaging across the first 7 rounds now has the Suns Rated at 905.4.
(Further support for Rating the Suns at around 900 comes from this last table in which the Suns' "true" average Rating is shown as 896.3.)
Using either of the methods just described required actual margin data and accurate Ratings for the Suns' opponents. Was there, I wondered, another way to estimate the Suns' "true" Rating using other information? What if we used TAB Sportsbet market prices instead, and first fitted a model linking Ratings differences to these market prices?
Again we proceed by assuming that MARS Ratings are most accurate late in the season and then fit a model to the data for Rounds 16 and greater across seasons 2000 to 2011 to obtain the following:
Expected Ratings Difference for Home Team = 17.06 + 37.46*ln(Bookie Prob for Home Team) - 5.584/ln(Bookie Prob for Home Team) - 9.25*Interstate Status
So, for a game played in the home State of the Away team (or in a State home to neither team) and in which the Home and Away teams are equal favourites, the expected Ratings difference is 17.06 + 37.46 * (-0.693) - 5.584/(-0.693), which is -0.8. In other words, in such a game where we found equal-favouritism on the TAB, we'd expect that the Home team would be Rated about 1 point less than the Away Team.
Now, we proceed as before, applying this equation to the market prices for all of the Suns' games in the first 7 rounds and then, assuming that the MARS Ratings of their opponents were accurate, estimating the Suns' "true" Rating for each game. Next we apply the equation to all games in the first 7 rounds, not just those involving the Suns, to estimate "true" Ratings for all teams, then use these new "true" Ratings to derive "true" Ratings for the Suns.
The results for these two approaches appear as the 3rd- and 4th-last columns (assuming that the MARS Ratings of the Suns' opponents were accurate), and the 2nd-last and last columns (assuming that we need to calculate "true" Ratings for each of their opponents by estimating implied Ratings differences from all games in the first 7 rounds).
Using these approaches we now have estimated "true" Ratings for the Gold Coast of 937.2 and 945.6, which are both considerably higher than those we estimated earlier. One conclusion from this might be that the TAB Bookmaker got his assessment of the Suns very wrong in the early part of the season. Whether we believe that or not, we should note that the Suns' Ratings after Round 7 are both around 923, which is a little closer to the 900 Rating we derived earlier.

For completeness, the "true" Ratings for each team, derived using the previous equation and the market prices for all games in the first 7 rounds, appears at right.
Generally it suggests much smaller adjustments are required to MARS Ratings to make them "true" Ratings. For example, for Adelaide the adjustment shown here is just 4.2 Ratings points compared to the 33.5 Ratings point adjustment shown in the earlier table.
This difference in magnitude can, at least in part, be attributed to the fact that actual game margins reflect more than just differences in teams' underlying abilities, but also include some "on the day" factors.
Note that we can again use the table of implied "true" Ratings shown here to come up with yet another estimate of the Suns' average early-season Rating. Here it's 937.9.
Okay, so, depending on the method you prefer, the "true" Rating of Gold Coast for early-season 2011 ranges from about 896 to 946 which, as we expected, precludes 1,000 as a reasonable estimate. If forced under duress to pick a number, I'd go with a 925 Rating for the Suns.
Before moving on to a Rating of GWS, it's worth spending a moment reviewing the equation we derived to link bookmaker prices to expected Ratings differences. Note firstly that this equation is a very good fit to the data, explaining over 80% of the variability in MARS Ratings Differences for the games considered. Here's what that equation looks like for Interstate Status = 1 (ie games where the Away team or both teams are playing out of state) and for Interstate Status = 0 (ie games where the Away and Home teams are playing in their home state). On the left is a chart depicting the relationship and on the right, a data table for selected values (both are clickable for larger versions).


To the problem at hand then: Rating GWS.
It turns out that a market has already been posted for GWS' first game in which they take on the Swans. That means we can use the second equation, along with the fact that the Swans will start the season with a MARS Rating of about 1,006, to derive a Rating for GWS.
The current market has the Home team GWS at $15 and the Swans at $1.01, giving a Rating for GWS, assuming that a Swans Rating of 1,006 is accurate, of:
1006 + 17.06 + 37.46*ln(1.01/16.01) - 5.584/ln(1.01/16.01) - 9.25*0
which is about 922.
I suspect that Sydney's price of $1.01 has been constrained by the TAB's reticence to post prices lower than this. If we instead say that GWS has somewhere between a 2.5% and 5% chance of winning then their implied Rating would be between about 886 and 913. Accordingly, I'm going to set GWS' initial Rating to 900. Let history be my judge ...
