The Drivers of Overround
/What features of a contest, I wondered this week, led to it having a larger or smaller overround than an average game? In which games might the bookie be able to grab another quarter or half a percent, and in which might he be forced to round down the overround?
The Data
For the analysis I used my database of TAB Sportsbet head-to-head prices, which are mostly as at noon on the Wednesday before the Round's games, starting with Round 1 of 2006 and going through to Round 10 of Season 2011, which is a sample of 1,003 games.
The variables used or derived for the analysis were:
- Overround, the target variable for this analysis, which was calculated in the usual way as 1/Home Team Price + 1/Away Team Price
- Home Team Price (with Home Team status determined by the AFL designation)
- Away Team Price
- Implicit Home Team Probability,calculated as Away Team Price/(Home Team Price + Away Team Price)
- Favourite's Price
- Favourite Team's Implicit Probability, calculated as Underdog Team Price/(Favourite Team Price + Underdog Team Price)
- Favourite Is Home Team,a 0/1 variable that is 1 if the Home Team is the favourite or equal favourite, and 0 otherwise
- Another 34 0/1 variables to denote whether team X is at home for the game (17 variables, one for each possible value of X), or whether team X is away for the game (the other 17)
- Round Number
The Hypotheses
Going into this analysis my guesses about overround were that:
- Games with a short-priced favourite might have a smaller overround because the bookmaker would be constrained in how short he could price the favourite and would not be able to attract enough action on the underdog if he priced it to generate his preferred overround. If the bookmaker feels constrained to offer at least $1.03 on the favourite, then a 7% overround can't be achieved with any underdog priced at much over $10.00 - even if the fair price for the underdog is $20 or more.
- Some teams - I wasn't sure which - would offer opportunities for the bookmaker to ratchet up his overround (since the team would generate irrational levels of wagering from its fans at prices shorter than would otherwise be offered).
- Games played earlier in the season would subject the bookmaker to greater levels of risk since he would have less of an idea of the relative strengths of the teams and so would respond by jacking up the overround.
The Results
Simple pairwise correlations between the available variables and overround show that, at best, only weak linear relationships exist:

Statistically speaking, only those correlations that are 0.05 or more in absolute size are significantly different from zero at the 5% level and, when we're looking at 39 correlations, we'd expect to get 1 or 2 correlations greater than this due to chance alone. In any case, a correlation of 0.05 means that the variable in question explains only one quarter of one percent of the variability in overround, which still leaves an enormous amount of explaining to do. So, I'm going to ignore all of the correlations that are 0.05 or smaller in absolute magnitude.
In doing this, Hypothesis #2 is ruled out. There is essentially zero evidence for any team that the overround for a game is, on average, higher or lower when that team is involved. For example, the average overround for games where Melbourne is playing at home is 1.07088, while in games where they're not it's 1.07. That's a difference smaller than 0.001, and that's one of the larger differences.
So we have just two variables to consider, Round Number and the Favourite's Implicit Probability.
Here's a chart showing how overround varies across a season.
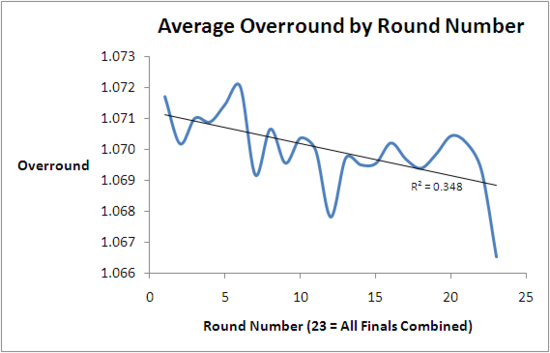
It's clear that overround tends to decline as the season progresses, but do note the scale on the y-axis which covers a range of only 0.007. We know from an earlier blog that 1% of overround is generally worth about 1% of ROI, so a punter wagering in the finals can expect, on average, to produce an ROI about 0.5% higher than the ROI he produces in Round 1 (ie 1.072 - 1.067). This trend explains, at least partly, why MAFL Funds have historically performed better in the later stages of the season.
So, we find some evidence to support Hypothesis #3 but, with a correlation of -0.18, Round Number explains only about 3% of the variability in overround.
Next let's review the graphical evidence for a linear link between overround and the favourite's implicit probability.

There does appear to be a general downward trend in this chart, but with a couple of downward spikes for probabilities in the range 62.5-65% and 75-77.5% and an uptick for games where there's a very short-priced favourite, the direct opposite of what I'd hypothesised in Hypothesis #1. Again, the explanatory power of this variable is small. With a correlation coefficient of -0.08, the Favourite's Implicit Probability explains only about 0.7% of the variability in Overround.
Do We Need to Go Deeper?
The final possibility to entertain is the existence of some non-linear relationship between the variables identified and overround. Perhaps, for example, the average overround for a game is higher when Melbourne's at home, but only if their price is above $3.
To find such non-linearities I tried rule induction. The only rules I uncovered, using parameter values to guard against overfitting, all involved only Round Number and the Favourite's Implicit Probability.
The Summary
So we now know that:
- Overround tends to fall as the season progresses.
- Overround also tends to be smaller in games with short-priced favourites, though not with very short-priced favourites (games with equal or near-equal favourites also tend to offer relatively good value.
- Overround is unrelated to the teams that are playing and to the venue at which they're playing
