2011 - Simulating the Finals - Part III - A Codicil
/As Dave Hughes might say, I'm confused.
Read MoreHere, based on the new MARS Ratings are the updated team-versus-team probabilities that I'll be using in this week's simulations:
 Collingwood are still predicted to defeat all-comers, though the likelihood that they'll defeat the Cats has reduced somewhat now that the Ratings Point gap between these two teams has been cut to 7.
Carlton's chances of defeating every other remaining team have risen this week, since it grabbed more Ratings Points than any other during Week 1 of the Finals. Sydney fared next best and so has seen its prospects improve when playing any other team but the Blues. Hawthorn and West Coast, both of which dropped Ratings Points this week, have seen their chances generally decline against the other remaining finalists, although the Hawks still remain favourites over the Eagles, Blues and Swans.
The results of the new simulations appear below, again with the newest data on the left and the outputs from last week's simulations on the right.

Based on these simulations, the Pies chances of winning the flag have barely moved as a result of their win this week and remain at just over 50%. Geelong, however, boosted its chances by just over 5% points, the same amount by which it caused the Hawks' chances to fall.
Carlton's and Sydney's chances rose by just a little, while the Eagle's chances, already slim, all but vanished on Saturday according to the simulation results.
(One additional, interesting element of the simulations is that while the Pies' Flag chances are virtually unchanged, they are now rated more likely to make the Grand Final (up from about 74% to 82%) but more likely to lose it if they do (up from about 30% to 36%)).
Based on these simulated team Premiership probabilities, only the Cats offer any value on the TAB and, at $2.75, it's very little value at that.
In the lower portion of the simulation results I've provided the simulation-based probabilities for each of the remaining possible GF matchups. A Collingwood v Geelong Granny has now firmed to be about a 2/1 on prospect, while the matchups of Geelong v Hawthorn and Collingwood v Carlton Grand Finals are both rated about 7/1 shots and on the second line of betting.
At present the GF quinella market is suspended on the TAB, so I can't say which if any of these pairings offer value.
In the previous blog I came up with some rules of thumb (rule of thumbs?) for determining what probability score was necessary to be profitable when following a Kelly-staking or a Level-staking approach, and what probability score was necessary to favour one form of staking over the other.
Briefly, we found that, when the overround is 106%, Bookie Bias is -1%, Bookie Sigma is 5%, and when the distribution of Home team probabilities broadly mirrors the historical distribution from 1999 to the present, then:
Taken together these rules suggest that, when facing a bookie of the type described, a punter should avoid betting if her probability scoring is under 0.014 per game, Level-stake if it's between 0.014 and 0.072, and Kelly-stake otherwise.
For this blog we'll determine how these rules would change if the punter was faced with a slightly more talented and greedier bookmaker, specifically, one with an overround of 107.5%, a bias of 0% and a sigma of 5%.
In this wagering environment the rules become:
Taken together these rules suggest that, when facing a bookie of the type now described, a punter should avoid betting if her probability scoring is under 0.075 per game and Kelly-stake otherwise. Level-staking is never preferred in this wagering environment because Level-staking is more profitable than Kelly-staking only for the range of probability scores for which neither Level-staking nor Kelly-staking tends to be profitable.
Essentially, the increase in the talent and greed of the bookmaker has eliminated the range of probability scores for which Level-staking is superior and increased the minimum required probability score to make Kelly-staking profitable from 0.072 to 0.075 per game.
Another week, another 1,000,000 simulations.
This week it's a relatively brief summary, since there are only four teams remaining and because TAB Sportsbet no longer has markets for teams' chances of making the Grand Final nor for the possible Grand Final pairings.
Here's what I have by way of simulation inputs and outputs:
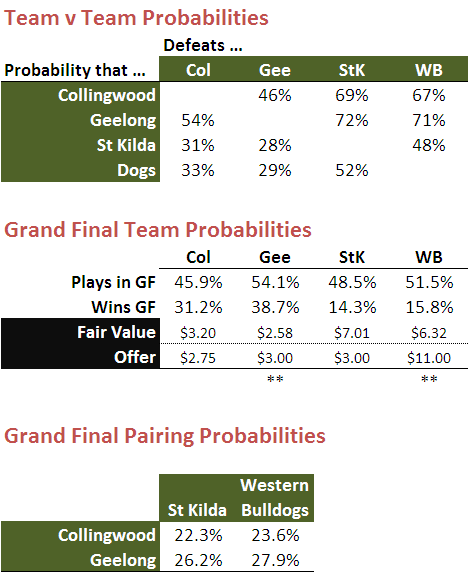
Firstly note that I have the Dogs, who have the higher MARS Rating, as favourites to defeat the Saints. That certainly isn't the way that the TAB Sportsbet bookie is seeing it: in the row labelled "Offer" you can see that he currently has the Saints at $3 for the Flag and the Dogs at $11. Not surprisingly, the simulations suggest the Dogs are very good value at that price - hence the double-asterisk under them.
The Cats too, however, are value in the Flag market, priced as they are at $3. The simulations suggest that anything over about $2.60 represents value for them.
Collingwood, at $2.75, are about $0.45 too short to be attractive, and the Saints, at $3, are way too short to be worthy of a punt.
All four possible Grand Final pairings are near equally likely, with a Cats v Dogs matchup marginally the most likely pairing for the Big One, and a Pies v Saints matchup the least likely.
Okay, six teams left, and you know the drill.
Here's the probability matrix I'm using this week (and again we're ignoring any home ground benefits):

Running the now customary 1,000,000 simulations using this matrix gives us the probabilities shown in the tables below. The rows labelled "Fair" contain fair value prices and those labelled "Offer" contain the most-recent TAB Sportsbet prices.

Double-asterisks denote those wagers that the simulations suggest represent value. As has been the case for a while now, the simulations suggest that the Dogs represent value in both the Flag and the Plays-in-the-GF market.
As well, the Cats are a value bet at $4 for the Flag; the simulations suggest that any price over about $3.30 for them represents value.
In contrast, Sydney and Freo represent appalling value at only $13 and $41 respectively. You'd instead want about $30 and $125 respectively to feel as though you were obtaining fair value for this pair.
Lastly, a look at the GF Quinellas, where you'll notice that only 9 possible Grand Final pairings remain possible:

Here, the value combinations are indicated by green shading, and all of the value bets involve the Dogs.
Whether the Dogs are value bets or not all still comes down to the extent to which you believe that the Dogs' recent performances are the best indicators of their likely performance next week and, if they survive, in the weeks that follow.
MAFL is a website for ...
(For those not wanting to use PayPal, my email address below is now also a PayID)
![]() Click on the envelope
Click on the envelope
Copyright © 2006-2025, Tony Corke. All rights reserved.
