Probability Score Thresholds: Reality Intrudes
/If you've been following the series of posts here on the five-parameter model, in particular the most recent one, and you've been tracking the probability scoring performance of the Head-to-Head Fund over on the Wagers & Tips blog, you'll be wondering why the Fund's not riotously profitable at the moment.
After all, its probability score per game is almost 0.2, well above the 0.075 that I estimated was required for Kelly-Staking to be profitable. So, has the Fund just been unlucky, or is there another component to the analysis that explains this apparent anomaly?
Whilst luck is, as always, in the ensemble cast, there are a few other explanations deserving of at least equal billing.
Variability in the Distribution of Home Team Probabilities
In all the simulations performed so far I've been using the same algorithm to randomly select the Home team probability for each game (described here). This means that the calculated probability score thresholds for Kelly-Staking or Level-Staking to be profitable and for Kelly-Staking to be more profitable than Level-Staking Level are dependent on the extent to which the season's actual Home team probabilities, considered as a whole, are similar to those that might have been generated by this algorithm.
So far this season the distribution of Home team probabilities has though been a little different from historical averages, mainly in the "tails" of the distribution (ie games with high or low probability Home teams). For example, whereas we'd expect based on history only about 10% of games to have the favourite rated as an 80% chance or better, we've had 17% of games where this has been the case this year. Also, we've had Home teams rated as less than 30% chances in 17% of contests compared to a long-term historical average of about 11%.
These differences serve to drive up the probability scores of well-calibrated probability predictors such as the TAB Sportsbet Bookie. To see why, consider the expected probability score for a well-calibrated predictor in a contest where the Home team is a 60% chance. Such a predictor's expected probability score will be 60% x (1+log(0.6)) + 40% x (1+log(0.4)), which is about 0.029 (recall that the logs are base 2).
Contrast this with what such a predictor could expect to score in a game with a short-priced Home team that's a 90% chance. For this game the predictor's expected probability score will be 90% x (1+log(0.9)) + 10% x (1+log(0.1)), which is about 0.531, almost 20 times as large as the expected score when the probability is 60%. The expected probability score for a game with a Home team rated a 10% would be the same.
The relative preponderance of very short-priced and very long-priced favourites has therefore led to higher probability scores for the TAB Sportsbet Bookie and, as a consequence, has increased the probability score required for profitability.
A Minor Tweak
What then to do about this?
Well this is the Simulations blog, so it'll not be a surprise when I suggest we just need to tweak the simulations we ran for the previous blog to allow for the distribution of Home team probabilities to vary, within reason, from the distribution we've been using in previous analyses.
The setup is as follows:
- As before, the overround is 107.5%, the Bookie Bias is 0% and the Bookie Sigma is 5%.
- We apply to the generated Home team probabilities for a given season a skew of between -5% and +5%. This serves to produce seasons of results with average expected probability scores within the range of those that have been observed empirically over the last decade.
Then, armed with the simulation outputs, we perform some magic using Eureqa to derive empirical fits to the Kelly-Staking and Level-Staking outcomes but this time, rather than using the Punter Probability Score as the explanatory variable, we use the ratio of the Punter Probability Score to the Bookie Probability Score. (When the distribution of Home team probabilities is held fixed the Bookie Probability Score is relatively stable from replicate to replicate. So, in previous blogs, it hasn't mattered that we've not divided the Punter Probability Score by what has been effectively a fixed Bookie Probability Score.)
These fitted equations are depicted in the following diagram:
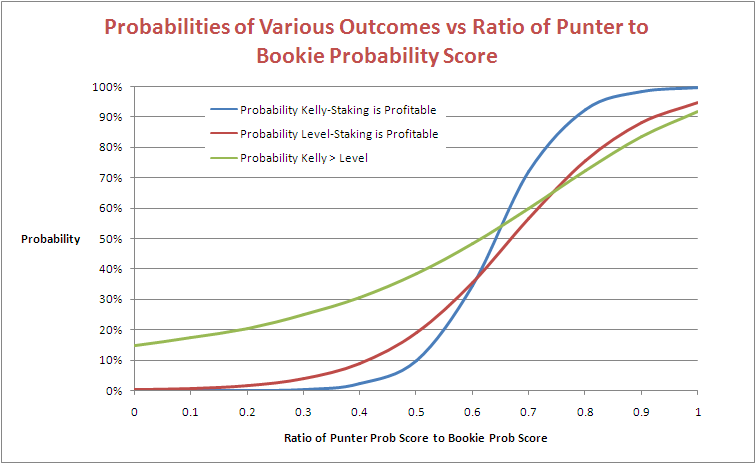
Consider the blue line, which traces the empirical probability that Kelly-Staking is profitable as a function of the ratio of the Punter's Probability Score to the Bookie's. The probability of making a profit using Kelly-Staking becomes more likely than not at a ratio of about 0.64.
Under the distribution of Home team probabilities that we've been using up until now the average expected probability score for a well-calibrated predictor is about 0.124 per game. In the previous blog we said that a score of 0.075 per game should be enough for Kelly-Staking to be profitable. Now 0.075/0.124 is about 0.6, so this is in reasonable agreement with the more general result we've found here.
Next consider the red line, which traces the empirical probability that Level-Staking is profitable as a function of the ratio of the Punter's Probability Score to the Bookie's. The probability of making a profit using Level-Staking becomes more likely than not at a ratio of about 0.67. In the previous blog we said that a score of 0.080 per game should be enough for Level-Staking to be profitable, and 0.080/0.124 is about 0.64, so that seems to reconcile too.
Lastly, consider the green line, which traces the empirical probability that Kelly-Staking outperforms Level-Staking as a function of the ratio of the Punter's Probability Score to the Bookie's. It suggests that this probability reaches 50% at a ratio of about 0.62. In the previous blog we said that a score of 0.074 per game should be enough for Kelly-Staking to outperform Level-Staking, and 0.074/0.124 is about 0.6, which gives us a trifecta of broad agreement.
(For those of you who are curious, these equation are:
- Blue line (Kelly-Staking): logistic(15.756816*(Punter Prob Score/Bookie Prob Score) - 10.092748)
- Red line (Level-Staking): logistic(8.6152897*(Punter Prob Score/Bookie Prob Score) - 5.7627821)
- Green line (Kelly > Level): logistic(5.1340003^(Punter Prob Score/Bookie Prob Score) - 2.7405019)
where logistic(x) = exp(x)/(1+exp(x))
The fit for the Blue line is very good, for the Red line is good, and for the Green line is acceptable.)
Good, But Still No Cigar
That's all very comforting as we now have a more general method for norming the performance of a probability predictor to account for Home team probability distributions that are different from the empirical distribution and/or variability in Bookie performance, but it still doesn't quite resolve the issue that I raised at the start of the blog.
At the moment, the probability score of the Head-to-Head Fund is about 96% of the probability score of the TAB Sportsbet bookmaker, at which level the blue line in the chart above suggests that profitability is a near certainty. Yet the Head-to-Head Fund is down by almost 10%.
There are two reasons for this:
- The Head-to-Head Fund is prohibited from wagering on Away teams
- The Head-to-Head Fund is also prohibited from wagering on Home teams priced at over $5.50
The probability score for the Head-to-Head Fund is, however, based on its probability assessments in every game, not just in those where it fancies a punt on the Home team and not just on those where the Home team is priced at $5.50 or less.
It turns out that, had the Head-to-Head Fund been allowed to follow its probability assessments in every game this year, it would currently be in the black, thanks partly to what would have been an obscenely lucrative wager on the Suns at $7.00 and also - would you believe it - to a profitable foray into Away team wagering. Surely, surely, that can't last ...
