Simulating the Finalists for 2013 : Post Round 21
/The competition now partitions neatly into four groups:
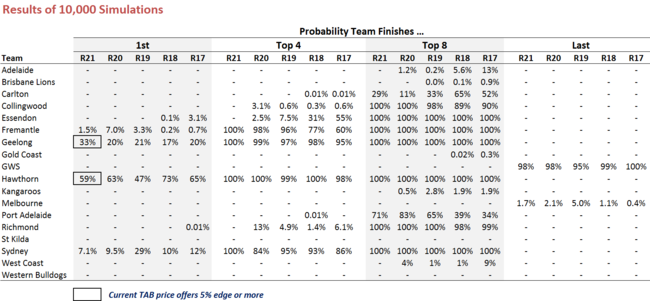
- Teams that are assured of a Top 4 finish (Hawthorn, Geelong, Sydney & Fremantle)
- Teams that are assured of a finish somewhere from 5th to 8th (Richmond, Collingwood and Essendon)
- Teams that will probably fight over 8th spot (Port Adelaide and Carlton - though Port Adelaide can dream of a finish higher than 8th)
- Teams that can make other plans for September unless the Dons are excluded from the finals and the Blues falter (the remaining teams)
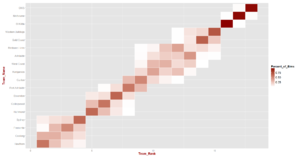
That makes for probability density manhattansTM with few buildings per team, and for a heatmap that looks mostly arctic.
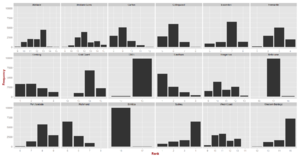
These charts were based on 10,000 simulations, this week using the margin assumptions about the remaining games as shown in the following table.
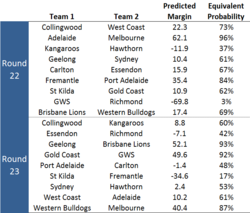 If results go the way we'd expect them to this week then the Blues will defeat the Dons, and Freo will do likewise to Port Adelaide, making Round 23's Port Adelaide v Carlton clash a game to determine who plays finals and who doesn't, since the Blues will go into that game 4 competition points behind Port Adelaide but with a superior percentage.
Looking at the potential fates of a couple of other teams, Sydney's current ladder position of 3 looks quite precarious when you note that they face Geelong this week and Hawthorn next, both of which games seem likely to be dress-rehearsals for the September ahead. Rationally, you'd have to think that the Swans will drop at least one of those games while Freo, who are equal with the Swans on points, would be good things to win both of their remaining encounters. That would lift Freo to 3rd and relegate the Swans to 4th.
On the TAB and in the MAFL simulations, the Hawks remain favourites for the minor premiership. For them to lose would surely take a Swans victory over the Hawks in Round 23 and wins by the Cats against the Swans and then against the Lions in the remaining two rounds, collectively sufficient in magnitude to drive the Cats' percentage above the Hawks'.
According to the MAFL simulations that outcome for the Cats is about a 2/1 shot.
Currently, the TAB Bookmaker rates this outcome for the Cats as something less than a 2/1 proposition, making the Cats a value bet on the TAB at the offered $2.15 price. As well, the Hawks are also value at their offered price of $1.85. The only other teams with a mathematical shot at the minor premiership, Sydney and Fremantle, are both priced by the TAB too short to be of any interest.
In other contests, in the Port Adelaide v Carlton race for a spot in the 8, MAFL simulations have Port Adelaide as almost 3/1-on favourites to secure the last finals spot. The TAB is still unwilling to post markets for the Top 8 - or for the Top 4 come to that - so I can't tell you whether this assessment accords or otherwise with the TAB Bookmaker's thinking.
Since I started performing these simulations of the Finaln, I've identified the following wagers as carrying positive expectation at the time:
- After Round 17: Adelaide to make the Top 8 at $8, and the Dons to make the Top 4 at $2
- After Round 18: Hawthorn to win the Minor Premiership at $1.60, and the Dons to make the Top 4 at $3.50
- After Round 19: Hawthorn to win the Minor Premiership at $2.50
- After Round 20: Hawthorn to win the Minor Premiership at $1.90
- After Round 21: Hawthorn to win the Minor Premiership at $1.85, and Geelong to win the Minor Premiership at $2.15
The bets on the Crows and the Dons are clearly forlorn, which means that, assuming (as per last year) 1 unit wagers on all the opportunities identified to date we currently stand to:
- Lose 0.15 units if the Hawks take the Minor Premiership
- Lose 5.85 units if the Cats take the Minor Premiership
- Lose 8 units if neither the Hawks nor the Cats take the Minor Premiership
SIMULATED ORDERINGS
With the composition of the Top 4 and Top 8 almost settled, again this week I thought it would be interesting to review the simulated orderings of the teams within the Top 2, Top 4, Top 8, and positions 7 to 10.
Let's start with the Top 4.
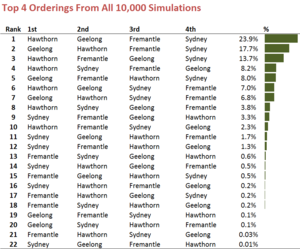 The simulations suggest that the most-likely finishing order for the Top 4 teams, relative to the ordering they have now on the competition ladder, is for Fremantle and Sydney to swap 3rd and 4th places. That was the outcome in almost one-quarter of the simulations.
Next-most likely was a Top 4 in which the Hawks and the Cats also swapped positions, a result that eventuated in about 18% of simulated seasons.
The only other ordering to appear in at least 10% of replications was a Hawthorn-Fremantle-Geelong-Sydney finish, which cropped up in a little under 1-in-7 outcomes.
All told, 22 possible orderings appeared at least once in the 10,000 replications, including the 1-in-10,000 outcome of a Sydney-Geelong-Fremantle-Hawthorn finish.
Next, let's look at the other half of the Top 8.
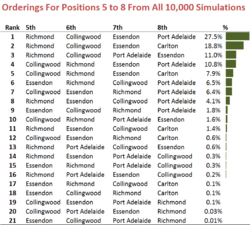 Richmond dominate 5th spot in the simulations, claiming that position in all three of the most-common outcomes, which collectively account for over 56% of replicates. In all of those same replicates, the Pies finish 6th.
For the next two most-common outcomes, the Pies and the Tigers swap positions, with the Pies finishing 5th and the Tigers 6th. These outcomes account for almost another 20% of the simulations.
The sixth most-likely scenario sees the Dons finish 6th ahead of the Tigers, Pies and Power. That's about a 1-in-16 prospect according to the simulations, but seems far less likely based on current form and current "environmental factors".
Here too I've shown the entirety of the outcomes produced by the 10,000 simulations, and here too there's a 1-in-10,000 outcome. It's for a Dons-Pies-Power-Tigers finish in positions 5 to 8. I reckon even a snowball would take on Hell in preference to that outcome.
So, now we've looked at the Top 8 in terms of its two halves. Next, let's take a look at just the Top 2.
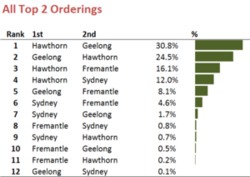 Again I've shown the full list of the orderings produced by the 10,000 simulations, and Hawthorn and Geelong occupy the first two positions in over one-half of those simulations.
The next most-likely outcome is a Hawks-Freo finish, which appeared in a little less than 1-in-6 replicates, and then a Hawks-Swans finish, which came up a bit less often than 1 time in 8.
A Geelong-Fremantle 1-2 finish - which, I'll admit, I considered a most unlikely outcome before running these simulations - came in 5th, appearing in about 8% of replicates.
Of the twelve orderings appearing at least once in the simulated ladders, a Geelong-Sydney 1-2 finish appeared least often.
As I mentioned earlier, the fight for 7th and 8th positions on the ladder is by no means determined. Here then, is the simulations' view of ladder positions 7 through 10, showing only those orderings that appeared in over 1.5% of replicates.
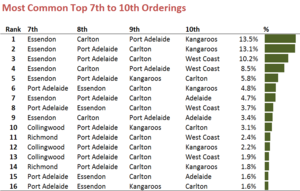 Essendon finishes 7th in all five of the most-common outcomes, which collectively account for over 50% of the replicates.
Across those same five outcomes, Port Adelaide finishes 8th in over one-half, and Carlton takes up this spot in the remainder.
Port Adelaide finishes as high as 7th in about 12% of replicates, and Carlton misses out on the finals by a single position over 50% of the time.
West Coast makes an appearance in positions 7 through 10 in only a bit more than 1 replicate in 4, and even then never finishes higher than 10th.
Lastly, let's take a look at the entirety of the Top 8.
Across the 10,000 simulations, 252 different orderings appeared, the most common of which are shown in the following table.
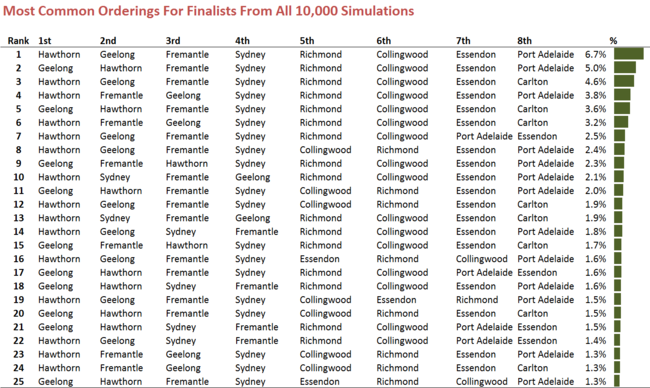 The most likely outcome, according to the MAFL simulations, in that Fremantle and Sydney swap ladder positions relative to the positions they occupy now. That ordering appeared in about 1 simulation in 16. Next most likely is the same ordering, but with the Hawks and the Cats swapping positions 1 and 2. That ordering appeared in about 1 simulation in 20.
