Simulating the Finalists for 2013 : Post Round 20
/As would, I'm sure, be obvious to most AFL followers, Round 20 results significantly reduced the Finals chances of Carlton and enhanced those of Port Adelaide, but the latest round of MAFL simulations allow us to quantify by how much team chances altered.
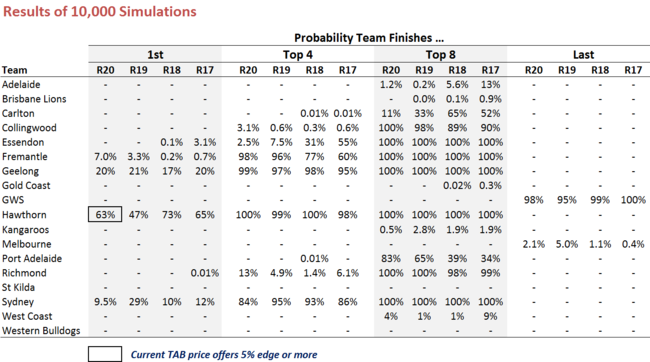 Carlton's chances of making the Finals after losing to the Dogs, these simulations reveal, dropped from about 1-in-3 to about 1-in-9, while Port Adelaide's grew from about 2-in-3 to over 8-in-10. Amongst the other teams on the fringe of the Top 8, West Coast's and Adelaide's chances also increased but remain small, while the Roos' chances, after losing to the Crows, diminished into near non-existence.
In other markets, GWS firmed for the Wooden Spoon, Hawthorn firmed for the minor premiership (and remain the only team representing a worthwhile investment in the markets currently offered by the TAB Sportsbet bookmaker), while Richmond and Collingwood enjoyed modest increases in their chances of finishing in the Top 4. Still though that 4 is much more likely to be inhabited at season's end by Hawthorn, Geelong, Fremantle and Sydney, the teams currently filling those places on the competition ladder.
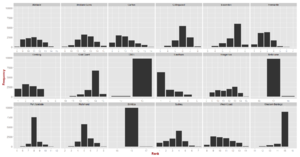
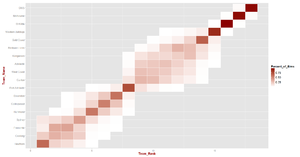
I'll come back to the Top 4 in a moment, but first, here are the usual density and heat maps, which depict the extent to which the remainder of the season, in large part, amounts to mere formalities and squabbles over generally insignificant final ladder positions.
MAFL simulations are, as always, based on teams' current MARS Ratings and on the simple model I've built to convert these Ratings into predicted game margins and probabilities of victory, which this week project likely margins for the remaining games as follows:
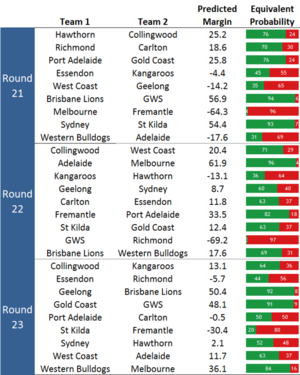
As you can see, Sydney, currently 3rd on the ladder, face a tough run home, whilst Fremantle and Geelong have a somewhat easier time of it, which explains why the two most common Top 4s in the latest round of simulations have Sydney finishing 4th.
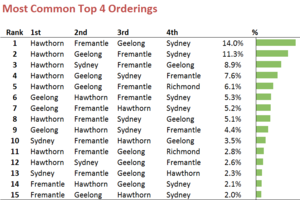 Slightly more hearteningly for Swans supporters, the third-most common simulation outcome has Sydney finishing 2nd, while the fourth-most common simulation result has them coming in 3rd. Far more troubling though for Red-and-White fans, the fifth-most common simulation output has the Swans missing the Top 4 altogether, with the Tigers grabbing the double-chance at the Swans' expense.
Hawthorn finish 1st in the five most-common simulated outcomes, while Geelong occupy this place in three of the next four.
A minor premiership for Sydney is only the tenth-most likely outcome with odds of about 30/1.
(By the way, for those followers of MAFL who are R users, the ability to produce the frequency counts to support this analysis was much facilitated by the count function in Hadley Wickham's plyr package.)
Focussing our attention on just the top two spots, the following summary of the latest simulations is germane.
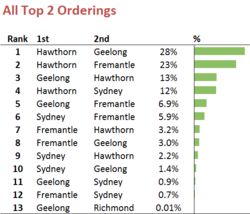 The most common 1-2 finish is a Hawks-Cats finish, which represents over one-quarter of the simulated end of home-and-away season finishes. A Hawks-Freo finish is the next most likely, and occurred in just a smidge under 25% of simulations.
A Cats-Hawks finish is next most likely and occurred in about one simulation in 8, which is only slightly more often than they produced a Hawks-Swans 1-2 finish.
After that we have only those finishes that occurred in fewer than 1-in-14 simulations, first amongst which was a Cats-Freo finish, which was slightly more likely than a Swans-Freo finish.
The remaining 1-2 finishes shown here, which are all the 1-2 finishes that my 10,000 simulations offered up, are each 30/1 chances or longer.
My favourite is the Geelong-Richmond 1-2 finish, which occurred is just a single simulation, its likelihood therefore the approximate equivalent of rolling 5 sixes with a single roll of 5 unbiased die, or producing 13 heads with a single toss of 13 unbiased coins.
There might also be some interest, I thought, in the simulations' predictions in relation to ladder positions 7 through 10, the more common predictions for which are summarised in the following table:
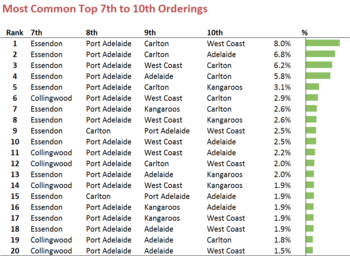 As you can see, Essendon and Port Adelaide inhabit ladder positions 7 and 8 in the majority of simulations, with Essendon in 7th in nine of the ten most-common combinations, and Port Adelaide in 8th in all but two of the 20 most-common combinations.
In the combinations that depart from the norm, Collingwood slips into 7th in the sixth-most common combination, which occurs is about 3% of simulations, and Carlton snatches 8th in the ninth-most common combination, which occurs in only about 1 simulation in 40.
