2012 - Simulating the Massey, Colley and ODM Rating Systems
/This year, over on the Wagers & Tips blog, we've been following the ratings produced by MAFL's own MARS Rating System and comparing these Ratings with those produced using the Massey, Colley and ODM Rating Systems (or, at least, my versions of them based on publicly available journal articles describing them).
Previously, I've made some halting attempts to assess the relative merits of each System, but in this blog I want to more systematically quantify the efficacy of the Massey, Colley and ODM Systems under defined simulation conditions. (I've excluded MARS for now only because of the time it takes to simulate a whole season's results for this System. At some point I will include MARS too.)
Simulating Team Strength and Results
What I need first of all is a way of quantitatively describing teams of varying offensive and defensive skill levels and a way of turning differences in relative team skills into expected game scores and expected game margins.
For this purpose I proceeded by taking the defensive and offensive performances - that is, the points conceded per game and the points scored per game - of the 18 teams as they stand now at the end of Round 12 in season 2012. This gives me an offensive and defensive "rating" for each team. So, for example, Adelaide have scored 102.6 points per game, so that's their offensive rating, and have conceded 82 points per game, so that's their defensive rating.
To simulate the Home team's expected score in a game against a specified opponent, I calculate:
- (Home Team Offensive Rating - Away Team Defensive Rating)/2 + Home Ground Advantage
Analagously, for the Away team I calculate:
- (Away Team Offensive Rating - Home Team Defensive Rating)/2
The expected margin from the Home team's viewpoint is then the difference between these values.
For the purposes of the current simulations I've held the Home Ground Advantage (HGA) fixed for all teams and all games in a given season.
Ranking the Teams
To come up with the "true" ranking of the teams I firstly simulate a single all-play-all home-and-away season, converting expected margins to victory probabilities by assuming that game margins are distributed as a Normal distribution with mean equal to the expected margin calculated for the game and standard deviation of 37 points per game. I've assumed a fixed HGA of 6 points. The Home team's victory probability is then the probability that a random variable drawn from this distribution takes on a value greater than 0.
Then, for each team, I've summed victory probabilities across all games to come up with an expected number of wins, which I then use to rank the teams.
It's this ranking against which we'll be judging the relative performances of Massey, Colley and ODM.
Simulation 1 : All-play-all Home-and-Away, SD=26, HGA = 6
First up I simulated 10,000 full seasons - I've simulated this many seasons for every scenario presented in this blog - and, for each season, calculated the Ratings that Massey, Colley and ODM would have produced on the basis of the simulated results of each game, then converted these Ratings to team rankings and calculated the Spearman Rank Correlation coefficient between the Ratings Systems' team rankings and the "true" ranking calculated in the manner described above. Higher positive correlations with the "true" rankings represents superior performance by a Rating System.
Because some of the Rating Systems require team scores and not just game margins, I've simulated each team's scores as follows:
- Home Team Score ~ N(Home Team Expected Score, 26)
- Away Team Score ~ N(Away Team Expected Score, 26)
I've assumed zero correlation between the Home Team and Away Team scores - an assumption I'd like to find a way to test in the future - and I've chosen 26 as the standard deviation because sqrt(26^2 + 26^2), the standard deviation of the difference between the Home Team and Away Team Scores, is about 37, which is the standard deviation we used for the game margin simulations above.
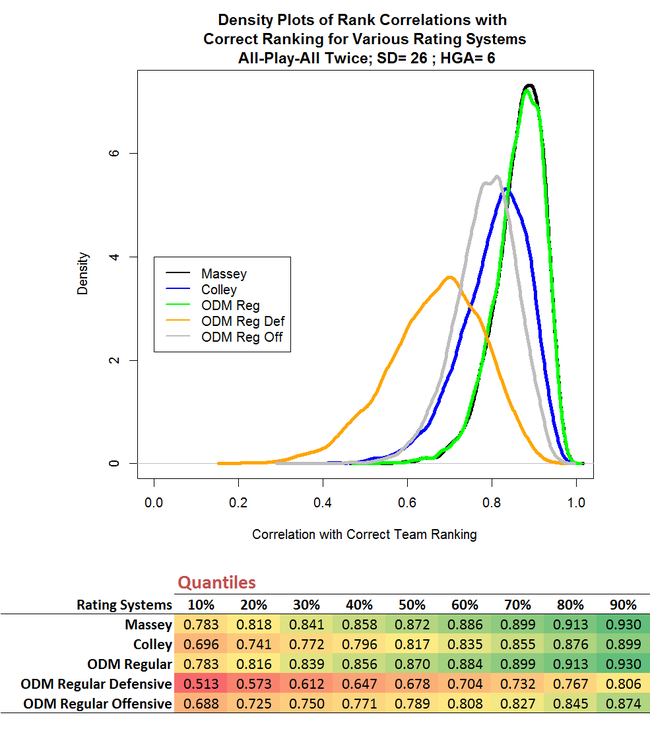 The chart above s a density plot and shows that Massey and ODM (which I've labelled here ODM Regular to differentiate it from ODM Average, which I'll describe a bit later) marginally outperform Colley. The chart also suggests that there's virtually nothing to split the Massey and ODM performances, which is reinforced in the table below the chart that provides quantiles for the data on which the density plot was based.
We can see, for example, that the median correlation for Massey is +0.800 and for ODM is +0.798 - both of which represent an impressively high level of agreement between Rating System and underlying team strength.
I've also charted and tabulated the data for the two components of the Overall ODM Rating - the Defensive and Offensive components. (I've taken the negative of the defensive component since it's defined in such a way that, unlike all other measures, smaller is better.) You can see that, at least for the configuration of relative team skills that I've used for the current simulations, teams' ODM Defensive Ratings are more strongly correlated with their "true" ratings than are their ODM Offensve Ratings.
Simulation 2 : All-play-all Home-and-Away, SD=26, HGA = 0
To some extent, the Home Ground Advantage masks the true underlying difference in team ratings because it boosts the chances of the Home team relative to the Away team. So, you might conjecture, eliminating the fixed Home Ground Advantage in the simulations might allow the Rating Systems to do a better job of assessing relative team strengths. Also, it might do this to varying degrees for the three Rating Systems.
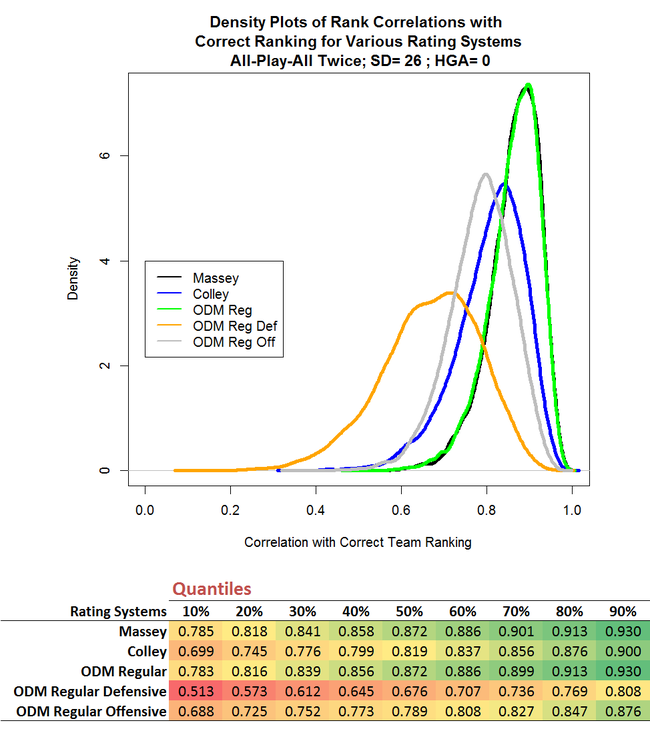 There is indeed an improvement in each System's ability to assess relative team strengths; it's directionally consistent across all Systems, but it's tiny. To three decimal places we can only detect it at the 70th percentile, and even there the difference is only 0.002 for Massey.
(The story might be different if the HGA varied by team or if it was itself a random variable - another thing to perhaps test in the future.)
Simulation 3 : All-play-all Home-and-Away, SD=15, HGA = 6
The degree to which competing teams' relative strengths will be masked in the eventual victory margin is also dependent on the standard deviation we assume for that victory margin, which we can think of as a measure of the "typical" amount by which the observed game margin will differ from the margin that's attributable to the underlying difference in team ratings.
So, it might also be interesting to simulate how Massey, Colley and ODM would respond if game margins became more predictable, in the sense that the standard deviation of the final margin was reduced from 26 points per game to 15 points per game.
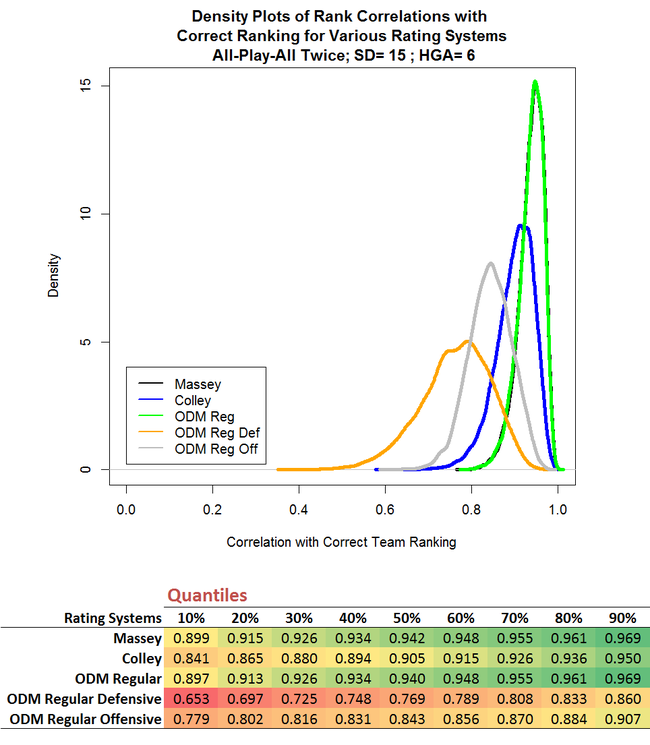 The effect of this change is far more dramatic and more differentiated than the change we saw when we eliminated the home ground advantage. Massey and ODM are each affected by about the same degree, while Colley benefits more than both of them. In quantitative terms, the 50th correlation percentile for Massey and ODM increases by about 8%, while for Colley it rises by 11%.
You'll recall that Colley ignores margins and considers only game results. Reducing the standard deviation of game margins makes it less likely for the "wrong" team to win, and therefore less likely than Colley will use a 1 where it should be using a 0 and vice versa The relative impact of this improvement on Colley is, apparently, greater than the improvement produced for Massey and ODM in using, say, a game margin of +20 instead of the correct margin of -10.
Simulation 4 : Play only a random 198 of the 306 possible games, SD=26, HGA = 6
Whilst Simulation 1 represented a situation somewhat similar to that which is faced by Massey, Colley and ODM in the current AFL season, it differed in at least one important aspect: it assumed a full all-play-all home-and-away season. In this year's draw only 198 of the 306 possible matchups (about 65%) are included.
To simulate truncated seasons of this type I selected, at random and without replacement, 198 games to include in each simulated season. Every such season will (probably) include a different subset of 198 games and I've made no attempt to ensure that in any single simulated season every team plays the same number of games as all other teams so, in this sense, the simulation is still somewhat unrealistic. Nonetheless, what it should provide is some quantification of the general impact on the efficacy of the Rating Systems when the season is truncated in a manner similar to that which we're witnessing this season.
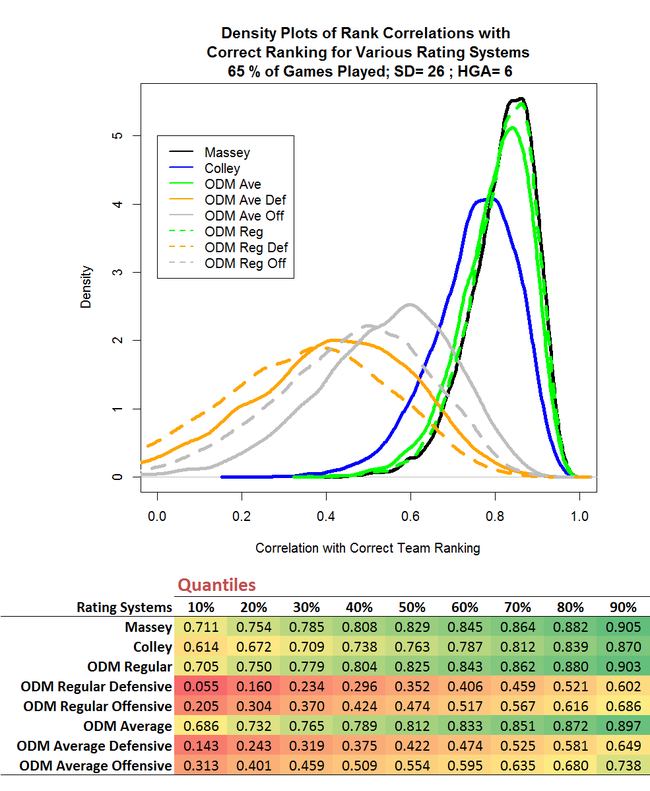 Measured in terms of the median value of the Spearman Rank Correlation, the truncated season reduces the efficacy of Massey and ODM by about 5%, and Colley by almost 7%. That's quite a bit less than I was expecting.
Currently, as a way of adjusting ODM for the fact that some teams have met twice during the season and others have met only once, I've been taking the average of the results for the repeated matchups. The results of the simulations presented above suggest that this is a bad idea, since the ODM Average figures, which I calculated by using the averaging approach just described, are uniformly worse than the ODM Regular figures, which are based on ignoring the fact that teams have met one another a different number of times.
That result is slightly surprising to me, but the intuitive logic of it, I think, is that every result tells ODM something about the relative merits of the teams involved, and attenuating the observed game margins for some games prevents ODM from learning as much as it otherwise would.
Simulation 5 : Play only a random 198 of the 306 possible games, SD=26, HGA = 0
Mainly for completeness' sake, I also ran the truncated season scenario with a zero HGA.
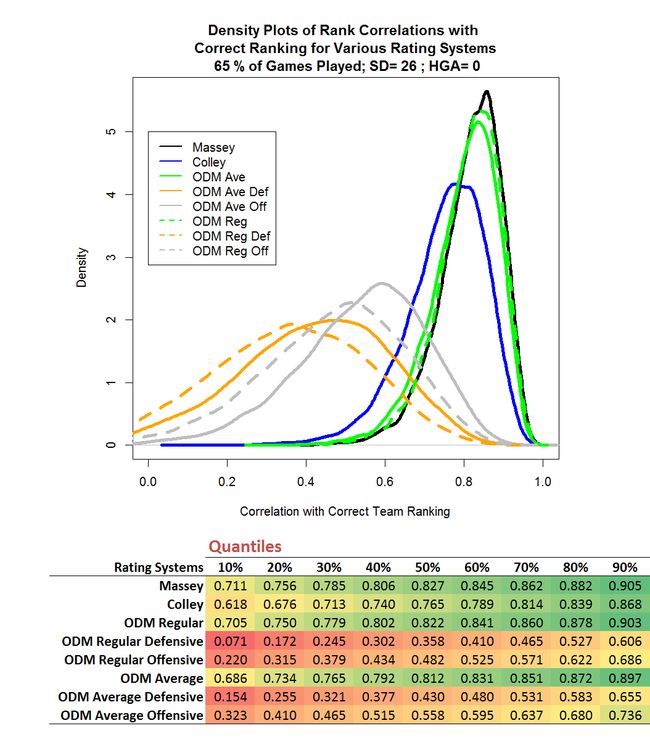 The differences in the results of this simulation compared to the previous simulation are tiny, as they were when we compared Simulation 2 with Simulation 1.
Simulation 6 : Play only a random 198 of the 306 possible games, SD=15, HGA = 6
Lastly, I've reduced the standard deviation of game margins from 20 to 15 points, to estimate the effect of this in a truncated season.
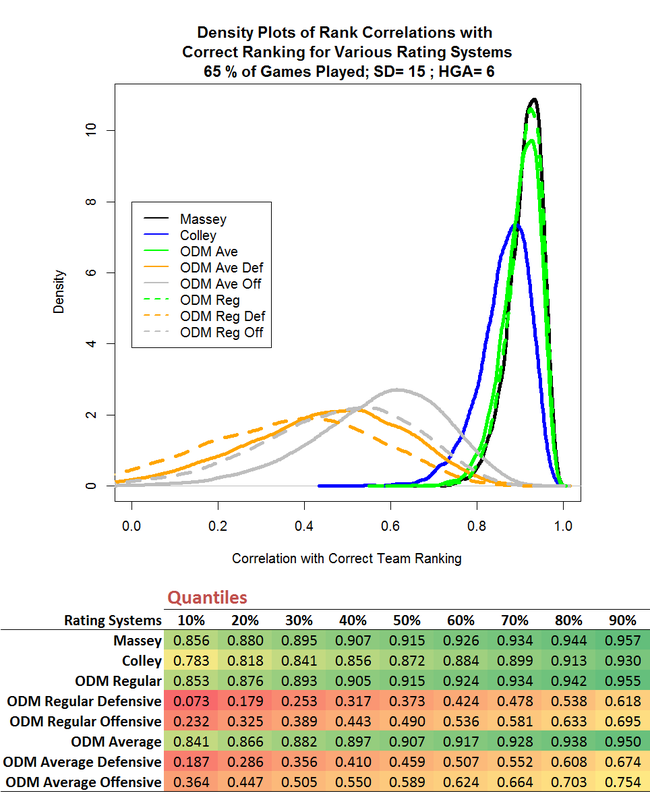 Here we find, at the median, an increase in the efficacy for Massey and ODM Regular relative to the simulations using a standard deviation of 26 points per game of about 10-11%, and for Colley of about 14%. These are larger effects than we saw in the simulations with untruncated seasons, suggesting that reduced volatility of game margins helps all Rating Systems more in truncated seasons than it does in untruncated seasons.
Conclusions
The practical conclusions I draw from these results (recognising that they might only apply to seasons with characteristics similar to those I've used for the simulations reported here) are that:
- Massey and ODM are likely to produce team rankings closer to the "true" team rankings (in the sense I've defined "true") than will Colley, but all three Systems will generally produce rankings very similar to the "true" rankings in most seasons
- The idea of averaging game results for repeated matchups is not recommended for ODM as it produces team rankings that are inferior to those produced using ODM without such averaging
- All the Rating Systems considered here, and especially Colley, benefit from lower levels of volatility in game margins. This might, for example, make Colley better suited to lower-scoring sports and/or games where the victory margin has a smaller relative standard deviation. In an Australian context, Rugby League immediately springs to mind, and I'm currently in the process of collecting the data necessary to run Massey, Colley and ODM on NRL results.
