Finding Value in the Markets for Final Ladder Positions
/In an earlier blog I used a simple method to create one view of the season's final home-and-away ladder.
Those projections had Collingwood finishing third because it lost narrowly to the Cats in Round 19 while the Cats and the Saints were projected to win all their remaining games. Three of the Cats' wins and two of the Saints' were by only a handful of points, however, so it was easy to imagine scenarios in which the ordering at the top was quite different and where, for example, the Pies finish top of the ladder.
The bookies are doing much more than imagining such scenarios: they're forming markets on the basis of them and they have the Pies as clear favourites for the minor premiership.
So, why the difference between my earlier projections and the bookies' view? Put simply, it's because the projections were created by taking each game, calculating a most likely victory margin for it, then aggregating each of these most likely results to form a final ladder. This approach tells where each team finishes if every game finishes with the single most likely result, and nothing more.
But that's not how you come up with a probabilistic view of the final ladder, which is what the bookies want. To create this view you need to simulate all the possible outcomes of every future game - not just consider the most likely outcome - and weight each possible outcome by an assessment of its probability. Using this approach will tell you, for example, in what proportion of the possible futures does Collingwood win the minor premiership, which is quite different to determining whether Collingwood wins the minor premiership if every game finishes with the most likely result.
If that's still a little unclear, this simple example might help. Imagine we play 3 sets of tennis and you're a 51% chance of winning each set. (For this example imagine that we play all 3 sets even if either of us wins the first two 2 sets). The most likely result in each set is that you win it, but the probabilistically most likely outcome is a 2-1 victory to you. Actually, even a 2-1 victory to me is more likely than a 3-0 victory to you.
Back then in football land, if we want to evaluate the bookie's market for the minor premiership, the top 4, the top 8 and the wooden spoon we need to create our own probabilistic estimates of the final ladder based on simulations of each game.
I'll come back later to the technical aspects of how I did this, but now I'll jump straight to the outputs.
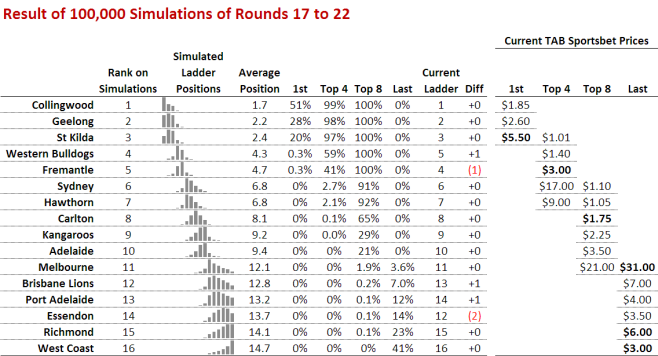
The column around mid-table headed 1st records for each team the proportion of simulations in which it finished first. So, for example, Collingwood finished first in 51% of the 100,000 simulations. The next three columns are interpreted similarly and provide the proportion of times that the team finished in the Top 4, Top 8, and Wooden Spoon positions respectively.
At the far right of the table are the TAB Sportsbet prices for various markets. Those prices that are in bold are prices that the simulations suggest are providing value. St Kilda, for example, at $5.50 for the minor premiership is value because simulations suggest they've about a 1-in-5 chance of taking that honour.
Similarly, Fremantle look good value for a spot in the Top 4 at $3.00 as the simulations rate them about a 41% chance of doing so. Carlton are also value for a finals berth at $1.75 since the simulations suggest they've a 65% chance of playing in September. Melbourne, Richmond and West Coast are all value Spoon bets, as their respective prices imply probabilities well below their simulated probabilities of finishing last.
Here are a few other things that I found interesting about these results:
- Collingwood, Geelong and St Kilda are virtual certainties to fill the top 3 spots in one order or another, and the Dogs and Freo are the only serious contenders for the remaining top 4 spot with the Dogs about 1.5 times as likely as Freo to claim it. Sydney's and Hawthorn's chances of finishing in the top 4 are actually quite remote - much more remote than the bookie's prices suggest.
- Collingwood, Geelong, St Kilda, the Dogs and Freo are all but assured of a spot in the finals, and Sydney and Hawthorn are also about 90% chances for another two of the spots. Only three teams are serious contenders for the eighth spot, Carlton, the Roos and Adelaide, with Carlton the heavy favourites amongst the trio. The Blues are twice as likely to make the eight as the Roos, and three times as likely as the Crows.
- Combined, the teams currently in positions 12 through 15 have about a 1-in-200 chance of making the eight. Sure that's small, but it's amazing that so deep into the season we have teams that are Spoon-contenders with any chance at all of a spot in the eight.
- Six teams have a shot at the Spoon. West Coast is a strong favourite, being as likely to finish with the Spoon as the next two most-likely contenders - Richmond and Essendon - combined. Melbourne, despite currently lying 11th on the table, have a better than 1-in-30 chance of slipping to last.
To finish, just a few paragraphs on the technical aspects of how I came up with these simulations.
For each game, I needed a statistical distribution to represent its outcome, the margin of victory. Previous analyses have shown that handicap-adjusted victory margins are (broadly) normally distributed, so that meant I needed a mean (ie the negative of the handicap) and a standard deviation for the victory margin for each game.
The mean was easy as I already had that from the earlier projections. It's just the following:
Predicted Victory Margin = 0.711959*(Own MARS - Opp MARS) + 13.9253*Interstate_Clash - 0.805606
Using another earlier model in reverse, the one I used to convert bookie probabilities into expected handicaps, I can convert this Predicted Victory Margin into a probability of victory for the team whose Predicted Victory Margin this is. Denoting the Predicted Victory Margin by V, the formula I need is just:
Probability of Victory = exp(V/22.3)/(1+exp(V/22.3)).
So, for example, a team that's expected to win by 25 points has about a 75% chance of victory.
The final step, which was to come up with the appropriate standard deviation to use in the normal distribution for the Victory Margin for a particular game, was the trickiest. What I needed was to find the standard deviation such that the probability of simulating a Victory Margin greater than 0 using the normal distribution with that standard deviation and with a mean equal to the Predicted Victory Margin for that game was equal to this Probability of Victory.
That no doubt sounds more complicated that it need be, but practically it meant choosing a standard deviation from somewhere in the 35.5 to 40 point range, with higher values being used for those games where the Probability of Victory was further from 50%. I came up with the appropriate standard deviation to use for a fixed range of victory probabilities and then used Eureqa to fit a model (a polynomial of degree seven as it happens) with which I could interpolate for other victory probabilities.
In truth, a fixed standard deviation of around 38 probably would have sufficed and not produced results very different from those that are here.
