2012 Round 1b : Results
/Three underdogs grabbed the competition points this weekend, none of them priced above $3.15 and two of them by less than a clear goal, so I reckon you'd call that a mostly predictable weekend.
Home Sweet Home aside, the average Head-to-Head Tipster bagged 5.5 from 9 for the round, with 13 scoring 6 from 9, and 13 more scoring 5 from 9. Margin prediction proved to be no more challenging, the average MAPE coming in at a gnat over 29 points per game. Best of all was Win_7 at 25.32 points per game, just ahead of five more Margin Predictors all recording performances under 26.60 points per game. One more Predictor, ProPred_3, also finished under the MAFL benchmark 30 points per game. Worst performed was H2H_Unadj_3 at 32.52 points per game, though even it managed to predict the result of three games to within two goals (and would have made money in the Super Margin market - see below).
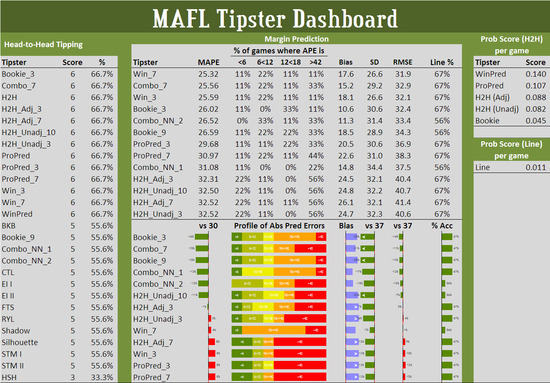
Many of the Margin Predictors tipped 6 of the 9 line results for the week, and all of them tipped at least 5 of the 9.
Results for the Probability Predictors see the TAB Bookmaker in an unfamiliar last place, with WinPred leading all-comers on 0.145 bits per game, largely as a result of confident calls on Sydney (84%), Hawthorn (70%), Adelaide (93%), and West Coast (69%). Once again, the H2H Predictors have had a strong first week of the season, though this season Investors have not profited from their prescience.
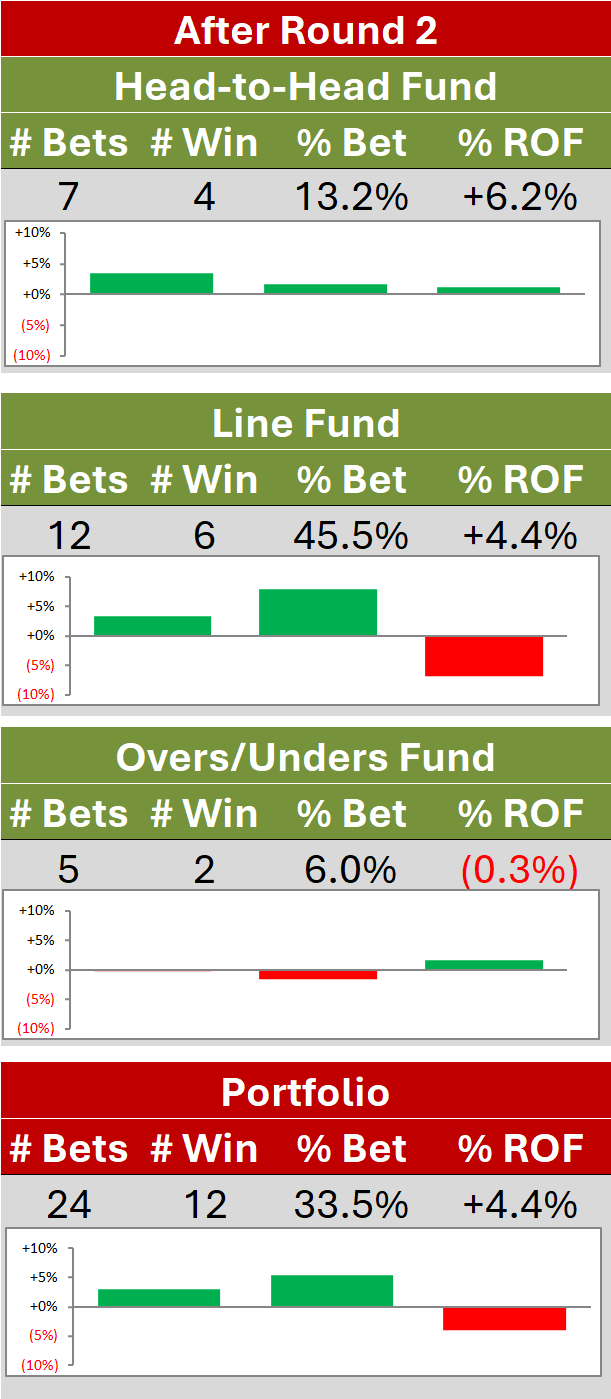
The Line Fund algorithm also fared well in the round, producing a marginally positive probability score despite only correctly predicting the line winner in 4 of 9 contests.
Investors' sole wager for the weekend, a wager on the Super Margin market, was emphatically unsuccessful, with Melbourne never seriously looking at though they'd produce the 1-9 point victory necessary to deliver the chocolates.
This being our inaugural foray into the Super Margin market, I thought it'd be interesting to track the performance of all the Margin Predictors in this market this year assuming that we wagered 1 unit on all of their predictions. Here are the results for Round 1:
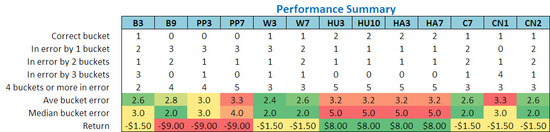
To create this table I've sequentially numbered each of the available margin "buckets" from 1 (for a home team win by more than 100 points) to 22 (for an away team win by more than 100 points). Then, I've compared the bucket of the predicted result with the bucket of the actual result and taken the absolute difference as the Predictor's bucket error. So, for example, a tipster predicting a home team win by 1-9 points would record a "bucket" error of 1 if the home team actually won by 10-19 points or if it lost by 1-9 points. (I've treated the Draw result as bucket 11.5).
All four Head-to-Head Margin Predictors recorded bucket errors of 0 in two of the games - in other words, they correctly predicted the bucket in which the final result landed and therefore would have registered a payout on the TAB had their predictions been wagered on. As a consequence, they are the only Predictors showing a positive return in the final row of the table.
CN2, the Predictor we're using for the Margin Fund this season, predicted the correct bucket in the Kangaroos v Essendon game, though, since it was predicting an away team victory in this case, its prediction did not result in a wager. As it was, Investors were better off wagering only on CN2's sole prediction of a home team win, since their 1 unit loss was better than the 1.5 unit loss that would have been recorded had all nine of CN2's margin predictions being wagered on.