2011 Round 26: Much Interest But Not Much Value
/With just two games on offer this round was unlikely to be financially influential, but the complete lack of interest from the Line Fund and the miserly approach of the Head-to-Head Fund have combined to make it a near non-event for Investors.
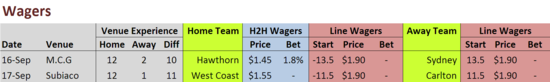
That single unstartling wager from the Head-to-Head Fund doesn't warrant a fully blown wager summary this week. The situation is as follows: if the Hawks win, the Head-to-Head Fund rises by 0.45 x 1.8% or about 0.8c, which means that Portfolios rise by half that, or 0.4c. If the Hawks lose, the Fund drops by 1.8% and Portfolios fall by 0.9c. Either way it'll be a rounding error in MAFL history; which is much as I feared and predicted.
It's also a fairly boring story from the point of view of our various Tipsters and Predictors, all of which have plumped for wins by the two favourites, though at least a number of the Margin Predictors can see the Blues making a fight of it against the Eagles, and ProPred and WinPred rate the Blues as 40-45% chances of creating the upset.
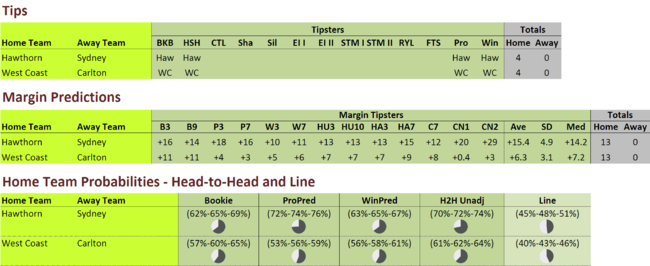
History's with the Tipsters and Predictors this week, especially for the Eagles v Blues game.
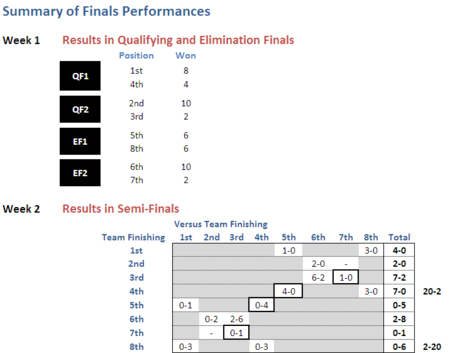 Across all the Finals series since 2000, teams from 4th and 5th on the competition ladder have met on 4 previous occasions in the Semi Finals, and it's been the team from 4th that's won every time.
The 3rd v 7th pairing has been rarer, having occurred only once previously, mostly due to the conspicuous lack of success in Elimination Finals of teams finishing 7th: last week, Sydney was only the 2nd team in 12 seasons to proceed to the Semi Finals from 7th position. When last 3rd met 7th, in 2006, it was the 3rd-placed Fremantle that emerged victorious over the 7th-placed Melbourne.
In general, teams with the double-chance have made much of their second lives. Across the 22 Semi Finals that have been decided between 2000 and 2010, teams from the top 4 positions have prevailed in all but two.
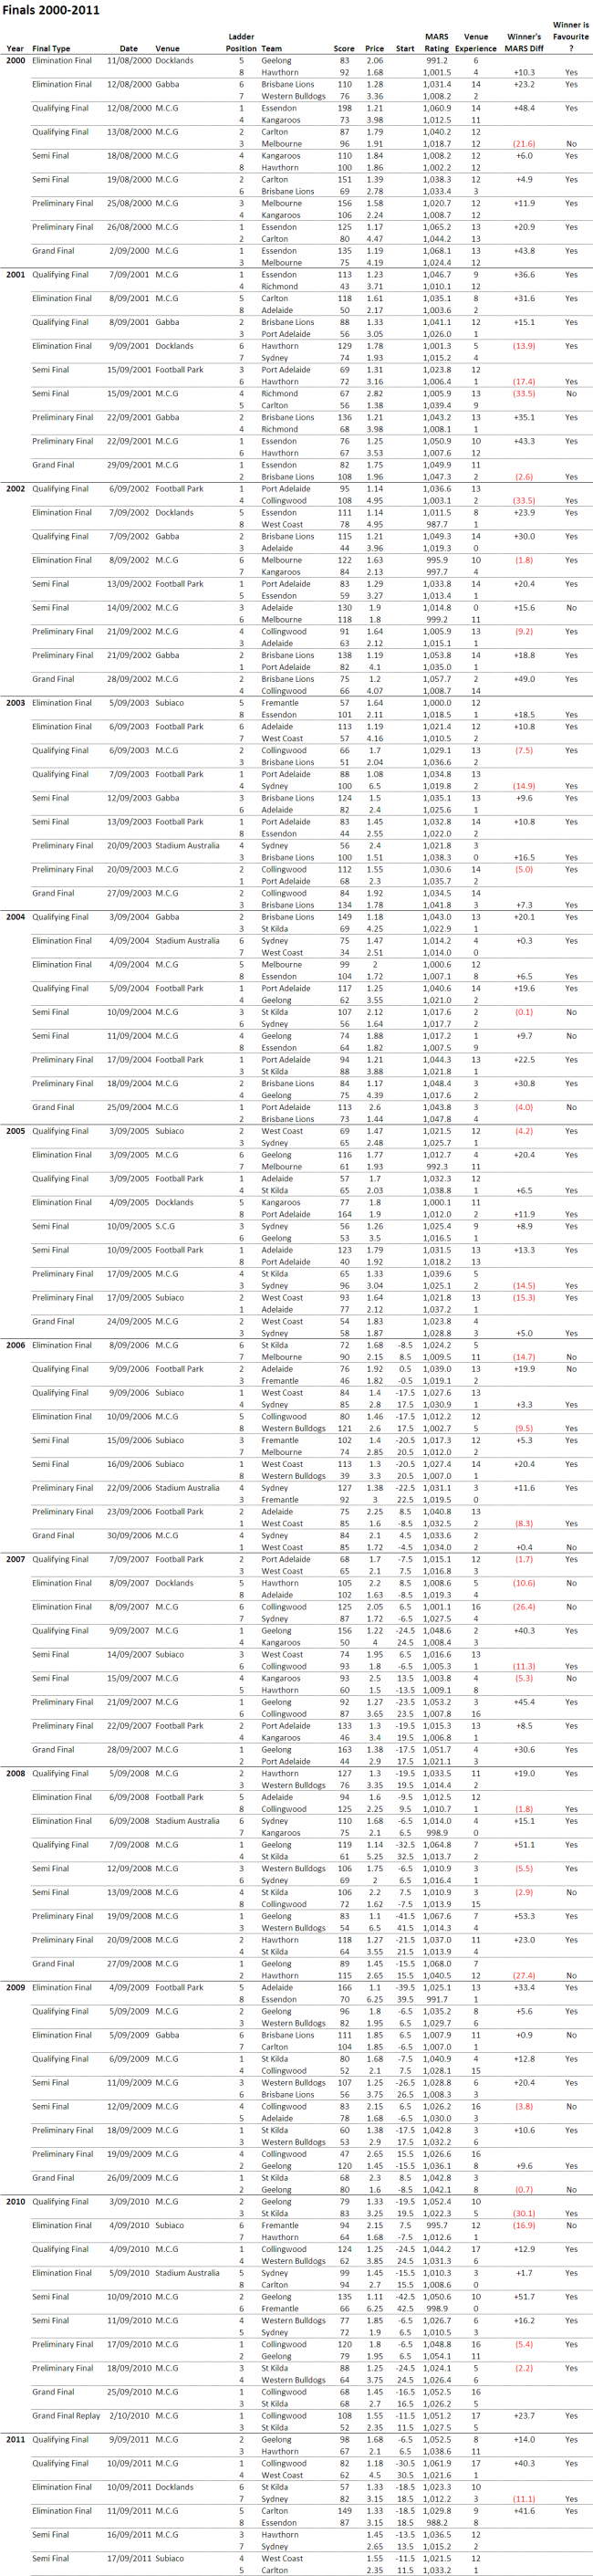
For anyone who's curious, here are the details of all the Finals since 2000.
Some summaries are clearly in order.
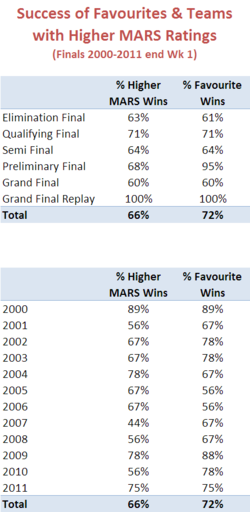
First, let's take a look at the historical levels of surprise associated with the results in Finals.
Unsurprisingly, finals have not been especially surprising. Across all the Finals from 2000 to last week, favourites have won 72% of them, and the higher-ranked team based on MARS Ratings has won two-thirds. Elimination Finals have produced the greatest level of surprise with only about 60% of favourites and higher-ranked teams prevailing in these Week 1 contests.
The next most surprise, however, has come from Semi Finals, so maybe there is some hope for the Swans and the Blues after all.
This year's Finals have not, however, started out as if they intend to startle. With 3 of the 4 favourites and higher-ranked teams winning last weekend, the current rate of success of predictable winners ranks the 2011 Finals as the 4th-least surprising of all series since 2000.
From the bookmaker's viewpoint, the Finals series of 2005 and 2006 jointly hold the record as the most surprising as it was in these years that only 56% of favourites were successful. Four other seasons - 2001, 2004, 2007 and 2008 - were the next least predictable as far as the bookmaker was concerned as favourites won only about two-thirds of the contests in those years.
Seasons 2000 and 2009 were the least surprising for the bookmaker as he correctly predicted almost 90% of the winners in those two seasons.
MARS Ratings - unadjusted for home team or interstate status - have been equal or better predictors of the outcome of Finals than the TAB bookmaker in 5 seasons: in 2004, 2005 and 2006, where MARS out-tipped the bookmaker, and in 2000 and 2011 (so far), where MARS has matched him.
In only one season has either MARS or the bookmaker failed to predict the winner in less than 50% of contests: MARS in 2007 when it predicted only 44% of the results.
To finish, let's take a look at the relationship between the difference in competing finalists' MARS Ratings and the eventual margin of victory.
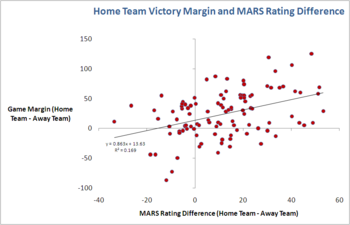 The chart at left has been created from the point of view of the AFL-designated home team, and shows a reasonably high degree of fit between the difference in the teams' MARS Ratings and the difference in the points they scored in their respective finals.
A simple regression line fitted to the data suggests that the best prediction of the home team's victory margin in a final is 13.6 points plus 86.3% of the difference between the home team's and the away team's MARS Rating.
Predictions made using this formula would have explained about 17% of the variability in the winner margins over the seasons 2000 to 2011.
Interestingly, adding venue experience and interstate status to the equation has a statistically insignificant effect on the fit, suggesting that these features are far less relevant in finals than they are in the home-and-away part of the season.
As well, models using:
- only the implicit bookmaker victory probability for the home team provides a marginally poorer fit (the R-squared is 15.4%)
- only the MARS difference and the implicit bookmaker victory probability for the home team provides a slightly superior fit (the R-squared is 18.7%), though the coefficient for the implicit bookmaker probability is not statistically significant while that for the MARS Rating differential is significant at the 5% level
- MARS difference, implicit bookmaker victory probability for the home team, venue experience for both teams, and interstate status is barely distinguishable from that with only the first two variables (R-squared is 18.9% and none of the newly introduced variables are statistically significant)
