2011 Round 7 Results: Well That's Better
/The Saints on Monday night came so close to punishing the Blues for their waywardness in front of goal and turning a good Round for Investors into a great one but, in the end, St Kilda fell just short, securing the Line Fund bet but not the Head-to-Head Fund wager, leaving the Head-to-Head Fund down just over 5% on the weekend and the Line Fund up just over 15%.
That means Investors' Portfolios are now down by 9% on the season but up 5% on the weekend.
Here's the Round summary:
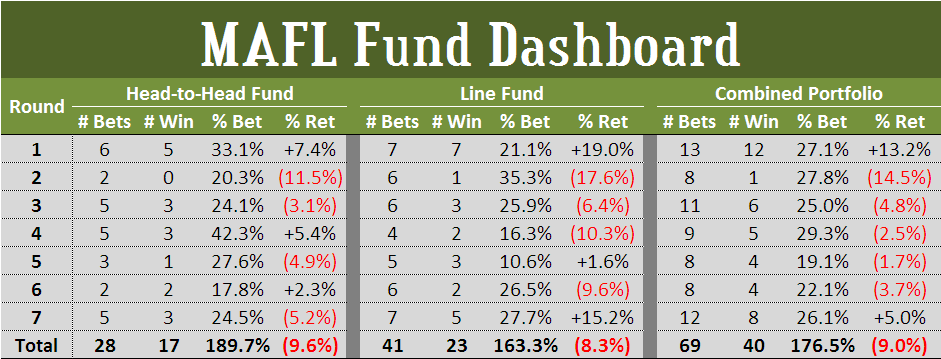
That's directionally better but, in aggregate, still on the wrong side of breakeven.
Carlton's victory was also enough to secure a perfect round's tipping for Ride Your Luck, whose 8 from 8 was enough to catapult it into joint leadership of the head-to-head tipsters on 37.5 from 53, tied with Short-Term Memory II.
Thereafter follow 8 tipsters, all on 36.5, including the three Bookie-based tipsters, the three Combo tipsters, Silhouette and Shadow. With only 5 Designated Home teams winning over the weekend, Home Sweet Home now finds itself alone in last place on 30.5.
Bookie_3 still leads on the MAPE metric, while Combo_7 has slipped into 2nd, and Bookie_9 into 3rd, relegating Combo_NN_2 into 4th place, now 2.37 points per game behind the leader. Sometimes, being different has its price.
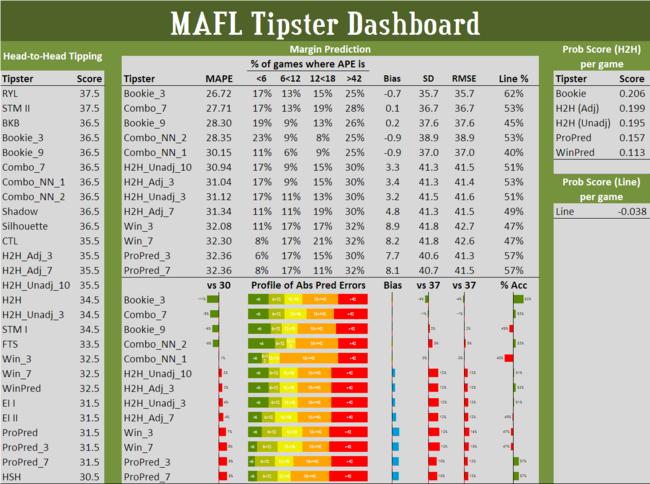
Combo_NN_2 still has the best record for predicting margins within 6 points of the eventual result, and is some 4% ahead of the next-best Predictor on this metric, Bookie_9.
Also, there have been some dramatic movements on the Bias measure, with the top 5 tipsters on MAPE now sporting Biases with an absolute value of less than 1 point. Consequently, it's the SD metric that orders all of these tipsters except Combo_NN_1, whose slightly larger bias is what's dropped it from 3rd to 5th.
On line betting, it's only the Predictor in 1st place, Bookie_3, and those in second-last and last place, ProPred_3 and ProPred_7, that have records substantially different from 50%. Once again we see the irrelevance of MAPE as a measure of a Predictor's suitability for line betting. The current correlation between the MAPE and Line betting performances of those Predictors for which both metrics are available in just -0.21, meaning that only about 4% of the variability in MAPE performance can be explained by variability in Line betting performance.
Lastly, to the Probability Predictors, where you might notice a few changes this week. Firstly, I've moved from a total probability score measure to a per game measure (motivated by the analysis I've been doing over on the Simulations blog), secondly I've fixed an error that I discovered in the calculations for H2H and ProPred, and thirdly I've distinguished between the performance of H2H Adjusted and H2H Unadjusted.
The good news is that the algorithm we're using for our head-to-head wagering, H2H Adjusted, is tracking at just a fraction below the TAB Sportsbet bookmaker on the probability score measure. Also, ProPred is outperforming WinPred on probability prediction, which is what it was designed to do.
It's also better news for the Line Fund algorithm, which is now within sight of performing at the level that would have been achieved by assigning a 50% probability to the Home team's chances in every game. Sometimes you've gotta rejoice in the small comforts.
