MAFL 2011 : Team Dashboard for Round 19
/The latest (clickable as always) MAFL Team Dashboard follows.
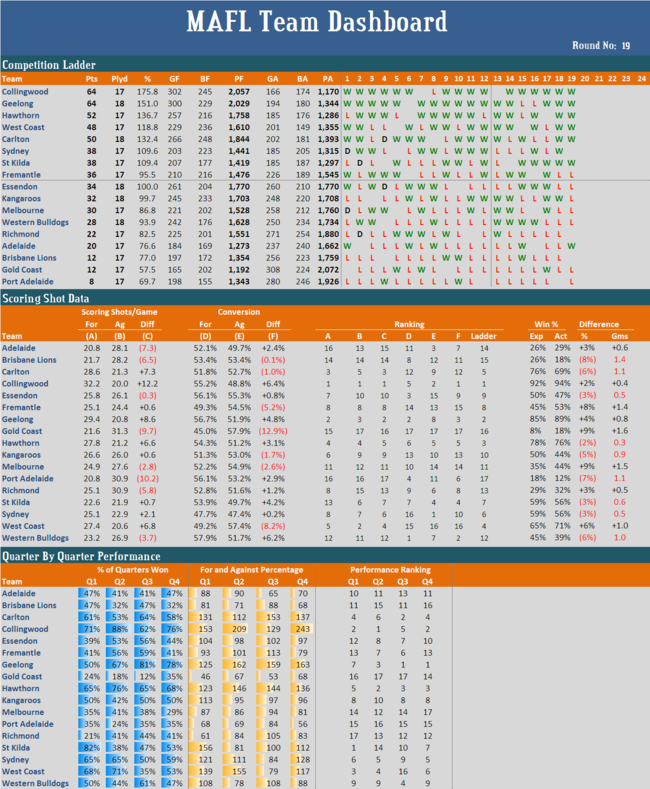
This week I calculated the rank correlations between teams' ladder positions and their ranking on some of the metrics in the Scoring Shot and Performance by Quarter sections. Here are the results:
- Rank correlation between ladder position and Scoring Shots For: +0.86
- Rank correlation between ladder position and Scoring Shots Against: +0.97
- Rank correlation between ladder position and Scoring Shots Difference: +0.98
- Rank correlation between ladder position and Own Conversion Rate: -0.09
- Rank correlation between ladder position and Opponents' Conversion Rate: +0.20
- Rank correlation between ladder position and Conversion Rate Difference: +0.12
- Rank correlation between ladder position and ranking on Q1 performances: +0.74
- Rank correlation between ladder position and ranking on Q2 performances: +0.89
- Rank correlation between ladder position and ranking on Q3 performances: +0.57
- Rank correlation between ladder position and ranking on Q4 performances: +0.85
What I make from all of this is that, so far this year, the better-performed teams have differentiated themselves by forcing their opponents to have more difficult scoring shots (and hence poorer conversion rates) and by being especially effective in 2nd and 4th quarters. It's interesting to note that seven of the teams currently sitting in finals positions on the ladder are amongst the top 8 teams ranked on 4th quarter performances.