The Value of MARS Ratings Points Across Time
/As we look at MARS Ratings across the expanse of VFL/AFL history, one thing we might want to consider is whether the value of a Rating Point has remained stable across those 13 decades. I've assumed, implicitly, that this is the case in the interpretations I've made of recent analyses, for example about the game's greatest upsets, but there's no a priori reason for this to be the case.
For this blog I've come up with a statistical approach to assess the extent to which the assumption of a fixed value of a Rating Point is supported by history's data.
THE METHODOLOGY
Firstly, we need to define what's meant by the term "value" in the context of Ratings Points. I'll define it here as the winning of a game. Given that definition, one way of assessing if Ratings Points have the same value in one season compared to another is to estimate if a given MARS Rating Point difference between the Home and Away teams leads to the same or a similar assessment of the Home team's victory prospects regardless of the seasons in which we assume the two games took place.
So, for example, we might ask whether a Home team rated 1,020 facing an Away team rated 1,000 is assessed as having the same victory probability in 2012 as a Home team in a similar position in terms of relative Rating playing in, say, 1950.
The first step is to estimate a binary logit model with the game result from the Home team's perspective as the target variable (so we exclude drawn games) and including as regressors a dummy variable to denote the season in which the game took place, and the MARS Ratings of each team.
Specifically, I fitted the following model:
ln(Prob Home win/(1-Prob Home win)) = a + b x Season Dummy + c x Home Team MARS Rating + d x Away Team MARS Rating + e x (Season Dummy x Home Team MARS Rating) + f x (Season Dummy x Away Team MARS Rating)
(I tried a range of parameterisations for this model and selected the fitted model with the highest AIC.)
By estimating various fitted values from this model we can assess the value - in the sense I've defined it above - of additional Rating Points to the Home team.
RESULTS
For this first chart I've plotted the estimated victory probability, for each season from 1897 to 2012, for the Home team in three different relative Rating scenarios:
- Where the Home team is Rated 1,020 and the Away team in Rated 1,000 (Blue line)
- Where the Home team and the Away team are both Rated 1,000 (Red line)
- Where the Home team is Rated 980 and the Away team in Rated 1,000 (Green line)
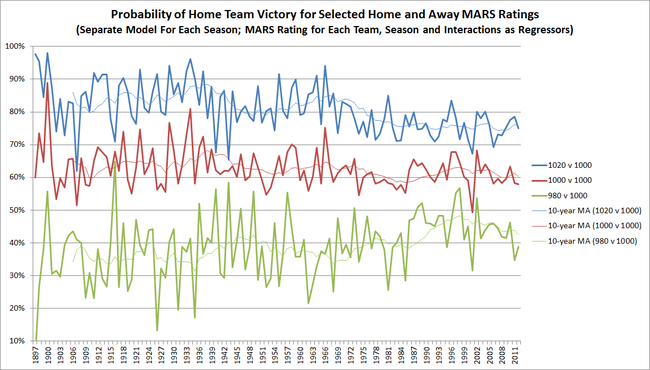 We can see then, for example, that a Home team Rated 1,020 facing an Away team Rated 1,000 (ie the thick blue line) has generally been assessed as having a victory probability in the 70 to 90% range with this probability showing a declining trend over about the last 40 years. The thin blue line, which is a 10-period uncentered moving average of the Home team's probability, helps make this trend more prominent.
A Home team facing an Away team with the same Rating (the thick red line) has been mostly rated as having a 60 to 70% shot at victory. These estimates have traded in a much narrower range and have shown a much milder, longer-term and less consistent but nonetheless downward trend from about the late 1930s.
The estimated chances of a moderately inferior Home team (the thick green line) show a pattern that is essentially a mirror-image of the chances of a moderately superior Home team (the thick blue line).
My first reaction when I produced this chart was that it implied that Ratings points had become less valuable in recent times, since having more of them wasn't generating as many expected wins for the Home team that accrued them.
But there's a confounding variable: Home team status. It could be that the decline we've estimated for moderately superior Home teams (and the incline for moderately inferior ones) is due to a diminished importance of Home team status rather than to a devaluation of MARS Rating Points.
We can adjust for this though by recognising that the red line in the chart above, which tracks the estimated Home team's chances when it is Rated identically to the Away team that it faces, and where both are "average" teams, is a natural proxy for Home team advantage. It measures the likelihood of a Home team victory when facing an equally-skilled and empirically "average" opponent, so the extent to which it exceeds 50% is a direct measure of the value - again in the sense I've defined it for this blog - of Home ground advantage.
For this final chart then, I've plotted the difference between the estimated chances of a Home team victory when Rated 1,020 facing an Away team opponent Rated 1,000, and that of a victory for a Home team Rated 1,000 facing an Away team with the same Rating. In other words, I've plotted the difference between the thick blue and thick red lines in the chart above.
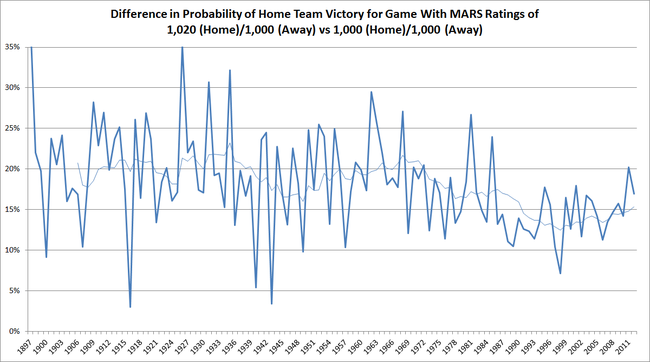 Based on this chart it seems that Ratings Points have been of varying value over the course of VFL/AFL history, but that the fluctuations have, broadly, been relatively modest. Focussing on the moving average line in the chart above - the thinner line, which removes some of the season-to-season volatility in the probability estimates - the peak to trough difference is only about 10% points.
Put another way, the value of an extra 20 Ratings Points to a Home team, that lifted it from a 1,000 to a 1,020 Rating, would have been about a 13% point increase in its victory probability at a minimum, and about a 23% point increase at a maximum. By way of context, only 17% of teams' MARS Ratings have exceeded 1,020 across the entire MARS Ratings history, so a 20 Ratings Point increase is empirically significant.
SUMMARY
I started by asking the question: have Ratings Points always carried the same value? My answer to this, at least for now, is that they have not, but that they've not varied in value so significantly as to render the assumption of stability untenable.
In short, interpreting an X Ratings Points difference in 1900 as being roughly equivalent to the same Ratings Point difference a century later is a reasonable, if mildly modern-day biased, approach.
