Bookmaker Implicit Probabilities: Empirical Value of the Risk-Equalising Approach
/A few blogs back I developed the idea that bookmakers might embed overround in each team's price not equally but instead such that the resulting head-to-head market prices provide insurance for a fixed (in percentage point terms) calibration error of equivalent size for both teams. Since then I've made only passing comment about the empirical superiority of this approach (which I've called the Risk-Equalising Approach) relative to the previous approach (which I've called the Overround-Equalising Approach).
So, in this blog I willl:
- compare the log probability scores (LPSs) of the Bookmaker Implicit Probabilities derived using the two approaches, across seasons 2007 to 2012
- compare the LPSs of the probabilities produced by the existing Head-to-Head Fund algorithm, which uses as one input the Implicit Probabilities derived using the Overround-Equalising Approach, with the probabilities produced by the same algorithm substituting the Implicit Probabilities derived using the Risk-Equalising approach
- compare the accuracy of the probabilities produced by the existing Line Fund algorithm, which does not use Implicit Probabilities at all, preferring instead to use the Start Offered by the TAB Bookmaker, to those produced by the same algorithm when the Implicit Probabilities produced using the Risk-Equalising Approach are included as an additional input
LOG PROBABILITY SCORES FOR THE OVERROUND-EQUALISING AND RISK-EQUALISING APPROACHES
The LPSs for the probabilities produced using the Overround-Equalising Approach have already proven difficult to match, so it's a tad disheartening to find that these scores are even higher, albeit only marginally, for the probabilities produced using the Risk-Equalising Approach.

Overall, and in five of the six seasons between 2007 and 2012, the LPS for the Risk-Equalising Approach is superior to that of the Overround Equalising Approach.
Though not shown here, I've also performed the calculations using the Brier Score and the Spherical Score, which are other arbiters of the performance of probability assessments, and these find that the Risk-Equalising Approach is superior using these too. You can even move the goalposts and not change the result ...
The superiority of the Risk-Equalising approach is also apparent if we look at performance on a round-by-round basis, aggregated across all six seasons.
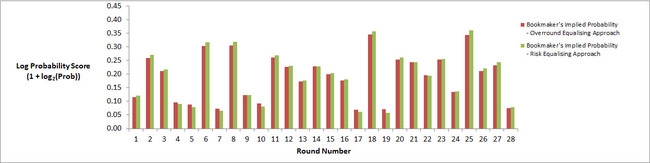
In summary, the Risk-Equalising Approach is superior in 21 of the 28 rounds.
I should note, in passing, that LPSs can't be compared across different sets of contests because the expected LPS for any well-calibrated predictor is a function of the underlying probabilities of the teams in each contest of the set. Put simply, a predictor should expect to produce higher LPSs if he or she is making probability predictions about games between mismatched teams than if he or she is making predictions about games involving near equal-favourites.
Consider, for example, a game involving an 80% favourite - and hence a 20% underdog. A well-calibrated predictor will assign a probability of 0.8 to the favourite and should expect an LPS for this game given by:
Expected LPS = 0.8*(1+log2(0.8)) + 0.2*(1+log2(0.2)) = 0.278
Compare this to a game where the favourite is a 55% chance, where a well-calibrated predictor should expect an LPS given by:
Expected LPS = 0.55*(1+log2(0.55)) + 0.45*(1+log2(0.45)) = 0.007
That's almost a 40-fold difference.
Given this, you can't look at the heights of the bars in the two previous charts and conclude, for example, that the Bookmaker performed more poorly in Round 5s than in Round 6s, or better in season 2010 than in season 2011.
What you can conclude though is that a predictor using the Risk-Equalising Approach is an even more formidable opponent than one using the Overround-Equalising Approach.
IMPACT ON THE HEAD-TO-HEAD FUND ALGORITHM
An obvious question is: does the improvement in the calibration of the Implicit Bookmaker Probabilities produced using the Risk-Equalising Approach translate into an improvement in the calibration of the probabilities produced by the Head-to-Head Fund algorithm?

The short answer is no, though the Risk-Equalising approach does allow the Head-to-Head Fund algorithm to record a superior LPS in four of the six seasons. It's the relatively exceptionally poor showing of the algorithm using the Risk-Equalising Probabilities in 2007 that results in an effective tie across all six seasons combined.
A round-by-round view shows that the two approaches produce very similar LPSs across every round of the season.
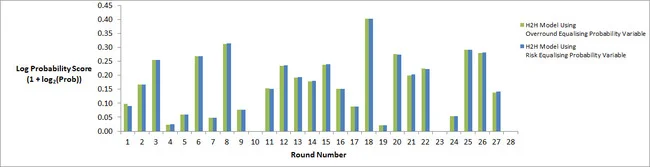
A detailed review of the underlying data reveals that the the Risk-Equalising Approach is superior for 16 of the 28 rounds, and is especially strong between Rounds 12 and 16, and between Rounds 24 and 27, for which it is superior in all 9 rounds.
The Risk-Equalising Approach is relatively inferior in the first 3 rounds of the season, in each of which the Overround-Equalising Approach is superior; between Rounds 6 and 11, which it loses 2-4; and between Rounds 17 to 22, which is loses by the same score.
In summary, the Risk-Equalising Approach has proven to be superior in a majority of seasons and a majority of rounds but is, nonetheless, no better than the Overround-Equalising Approach overall, at least in terms of LPS.
To be clear, all I've shown here is that the Head-to-Head Fund Algorithm does not benefit greatly in terms of LPS from using the Implicit Probabilities derived using the Risk-Equalising Approach in comparison to those derived using the Overround-Equalising Approach. What I've not assessed (here) is whether it benefits when it chooses to wager. More on this in a future blog.
IMPACT ON THE LINE FUND ALGORITHM
I like to think of the Line Fund Algorithm as a more sensitive soul, wracked by the challenge of deciding whether the start offered by or afforded to the Home team is sufficient to induce a wager. If that view is apt then the injection of a better-calibrated probability estimate seems more likely to assist than not.
It's important to note firstly that the existing Line Fund Algorithm does not use Implicit Probability as an input at all so, unlike the Head-to-Head Fund algorithm, when we use the Implicit Probabilities derived from the Risk-Equalising Approach, we're not substituting for an existing regressor but are, instead, adding a new one.
That addition seems to help, firstly in terms of the accuracy of the model.

For this chart we've merely assumed that a probability assessment for the Home team of greater than 50% implies positive endorsement of the Home team, and we've calculated accuracy accordingly. The blue set of bars records the performance, across all games, of the existing Line Fund algorithm relative to the same algorithm with Risk-Equalising probabilities as an additional input, and shows that the algorithm with the extra input is marginally superior across the six seasons.
In wagering practice, the prognostications of the Line Fund algorithm are only acted upon when the algorithm's assessment is that the Home team will win on line betting, so there's a case to be made that its accuracy only matters for these games. This is depicted in the black and grey bars above, which show that the Line Fund algorithm is indeed fortified by calling upon the services of the Implicit Probabilities produced by the Risk-Equalising Approach.
Turning next to a round-by-round view, firstly in terms of accuracy for predictions of all games, we find a mixed bag of results when comparing the incumbent Line Fund algorithm with the same algorithm allowed to use the probabilities derived from the Risk-Equalising Approach.

A more detailed review shows that the Line Fund algorithm with Risk-Equalising probabilities included is superior in just 12 of the 28 rounds, in particular for Rounds 5 to 11 where it is superior in 5 of the 7 rounds, and in Rounds 16 to 19, where it is superior in all.
The Line Fund algorithm incorporating Risk-Equalising probabilities struggles especially in Rounds 3 to 7, in which it is superior in just a single round; in Rounds 12 to 15, in which it is superior in none; and in Rounds 20 to 28, in which it is superior in just one.
Overall, however, the Line Fund algorithm with Risk-Equalising probabilities remains narrowly superior.
Again though, recognising that the Line Fund's views matter most when it tips a Home team line victory, we should review the round-by-round accuracy of the incumbent Line Fund algorithm compared to the version incorporating Implicit Probabilities from the Risk-Equalising Approach.

Again we find that the Line Fund algorithm incorporating the Implicit Probabilities from the Risk-Equalising Approach is marginally superior across all rounds. It's strongest relative to the incumbent model between Rounds 1 and 11, which it wins 7-4, and between Rounds 16 and 19, which it wins 4-0. It's weakest between Rounds 12 and 15, which is loses 0-4, and from Rounds 20 onwards, which it loses 1-8.
Finally, let's review the LPS performance of the incumbent and the "enhanced" Line Fund algorithms.
Initially, let's consider all probability predictions.

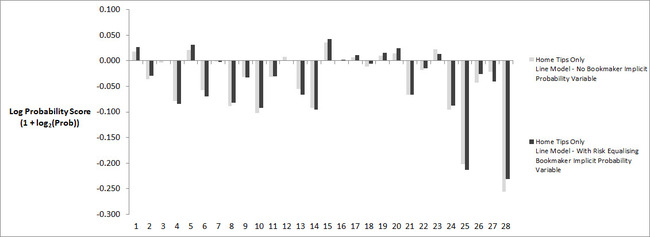
(Remember, less negative and more positive outcomes are superior.)
We find that the Line Fund algorithm with the benefit of Implicit Probabilities from the Risk-Equalising Approach is superior in 18 of 28 rounds. In particular, the "enhanced" Line Fund algorithm is superior in 7 of the first 11 rounds and in 11 of the last 14 rounds; it loses out to the incumbent algorithm in each of Rounds 12 to 14.
Lastly, consider the relative performance of the two Line Fund algorithms when they determine that the Home team is the more likely line betting victor.
Again we find that the "enhanced" algorithm wins 18 of 28 rounds including 7 of the first 11 rounds of the season and 11 of the last 14, with Rounds 12 to 14 the only significant contiguous Achilles' Heel.
SUMMARY
If we deploy the Implicit Probabilities derived using the Risk-Equalising Approach:
- As an estimate of the TAB Bookmaker's true Implicit Probabilities
- The LPS is marginally improved overall, and is improved for 5 of 6 seasons and 21 of 28 rounds
- As a substitute for those derived using the Overround Equalising Approach in the Head-to-Head Fund algorithm
- The LPS is virtually identical overall, and is improved in 4 of 6 seasons and 16 of 28 rounds
- As an additional regressor in the Line Fund algorithm
- The accuracy improves marginally both overall and when the algorithm predicts a Home team victory
- The LPS improves for all contests and for those contests where the algorithm predicts a Home team line victory
- The LPS is superior in 18 of 28 rounds whether we consider all predictions or only those where the Home team is predicted to win on line betting
That seems to me to be sufficient evidence to investigate the empirical wagering performance of the Head-to-Head and Line Fund algorithms incorporating Implicit Probabilities from the Risk-Equalisation Approach.
So, investigate I shall ...
