Do Fans Really Want Close Games?
/The AFL Draft is predicated on a belief that the equalisation of talent across teams across time is somehow good for the sport. It seems a reasonable premise, but how might we test it? Well, if it's true, one of the ways it should manifest is in attendance figures.
Put simply: do games where the result is more uncertain draw larger crowds?
The Data
The website owner over at afltables has done all the hard work of gathering attendance figures for every AFL game ever played. It's from those pages that I scraped the requisite attendance data for the 2006 to 2012 home-and-away seasons.
Now, what variables are likely to effect crowd figures? Some obvious candidates are who's playing, where they're playing and on what day they're playing. This is data that I already have.
I also need some measure of the uncertainty of each game's result and a ready-made candidate for this measure is the pre-game expected surprisals (or, more correctly, "Entropy") of the game, which is defined as:
Entropy = - Prob(Home Team Wins) * log(Prob(Home Team Wins) - Prob(Away Team Wins) * log(Prob(Away Team Wins))
If we calculate the logs in base 2 then our unit of Entropy is bits. The more uncertainty associated with a game the higher will be its Entropy up to a maximum value of 1.
To give you a feel for Entropy values for games pitting teams of different strengths, here are some games from 2012 with the Entropy calculated from the actual pre-game head-to-head TAB prices:
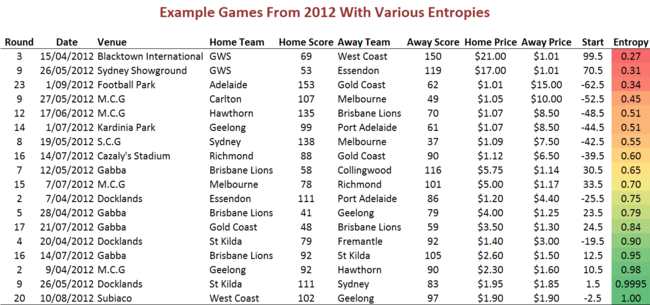
So, it's rare for Entropy to be much below about 0.50 (we need about a $9 underdog for this to be the case) and the maximum value of Entropy is 1, which occurs when we have equal favourites.
That's all the data I'm going to use for this analysis, although I am also going to create a derived variable which I'll call "Home Favourite" and which takes on the value "Yes" if the Home team for a particular game is the clear favourite.
Basic Data Analysis
If the doctors' oath is "First, do no harm" then data analysts' should be "First, know your data". Let's take a look.

It's news to no-one, but the table shows per game attendance levels have been sharply lower this season, down by over 3,000 fans per game and this from a figure already over 2,000 lower than for the year before that, 2010.
Most, but not all, of this decline is due to the lower attendances at GWS and Gold Coast games. Excluding contests involving either of these teams lifts the 2011 average to 36,603, and the 2012 average to 35,417, which is undeniably better, but still down from the peak of nearly 37,000 per game in 2008.
As the AFL ponders the home-and-away schedule for 2013 I wonder how heavily the (lack of) drawing power of the Giants and the Suns will factor in its decision-making.
If the Suns and Giants don't draw the fans, who does? Let's look at attendance on a team-by-team basis.

Collingwood, it turns out, have been the crowd-pullers over the past seven seasons. When playing at home they've drawn average crowds of almost 58,000, and they've drawn only about 4,000 fewer when they've been playing away (sometimes, of course, only notionally away since they share their home ground, the MCG).
Essendon, Carlton and Richmond have each also drawn average home crowds in excess of 40,000, and have about the same sized crowds when playing away too.
Adelaide pulls nearly 40,000 at home, but over 10,000 fewer when playing away and is the team with the largest difference between its average home and average away attendance figures. Two other non-Victorian teams, Fremantle and West Coast, have the second- and third-largest differences.
A number of teams have drawn, on average, larger crowds when playing away than when playing at home, perhaps due to the constraints of their home ground, or due to the league's tendency to schedule more of their "blockbuster" games as away games.
The, as yet, relatively limited appeal of the newer and less successful clubs is apparent when you scan the teams at the bottom of the list. For example, the Suns and the Giants (discussed earlier) have attracted less than half the average home crowd that the "average" team has done since 2006.
Next we'll take a look at the 17 venues that have been used by the AFL for home-and-away contests over the past seven seasons, albeit some of them only rarely.

On average, the G has drawn almost 50,000 fans per game, over 8,000 more than any other venue that's been used over the period.
Stadium Australia has the second-highest average at almost 42,000, followed by Subiaco, Docklands, Football Park, and the Adelaide Oval (used only once during the period) all with averages of 30,000 to 35,000.
Amongst the grounds that have generally failed to pull a crowd - mostly for capacity reasons - Marrara Oval is one that's been used relatively often. It's had 10 games across the seven seasons and has averaged only just over 10,000 attendees for each of those games.
Manuka Oval is another ground in this category having been used 14 times and drawn an average of only just over 11,000 fans for each game.
The average for Kardinia Park at just over 22,000 provides some rationale for why the Cats have been willing to forego home ground advantage in a quest for higher gate takings on a number of occasions in recent years.
So we've considered who and where; let's look at the when - or, more precisely, the "what day of the week".
Twice during the past seven seasons a game has been scheduled on a Wednesday, and twice more on a Tuesday, all four of them blockbusters that have pulled significant crowds. So much so, in fact, that the average attendance for these two days of the week exceeds that for all five other days.

Mondays have also been used fairly sparingly by the AFL with just 22 contests scheduled on this day. But, when they have been used, they've been used to very good effect. The average crowds for games at the start of the week has been over 56,000.
Thursday is the next best day in terms of average crowds, though only 16 games have been scheduled on a Thursday during the past seven seasons.
Then follows the now-traditional football days of, in chronological and crowd-pulling order, Friday, Saturday and Sunday, with Friday games drawing, on average, much larger crowds than games on the weekend.
Enter Entropy
Statistical modellers love to see variability since, without it, there's nothing to explain and nothing to explain it with. So far we've seen plenty of variability in the variables we've considered. What about Entropy then? Here I've tabulated Entropy by team and by whether that team is playing at home or away.

The Roos have been associated with the highest average level of Entropy of all teams when playing at home, and they've also been associated with above-average levels of Entropy when playing away. If, over the past seven years, you wanted to support a team that was generally a reasonable shot at winning - but also at losing - each week, then the Roos would have been ideal for you.
Sydney's the team associated with the highest levels of average Entropy when playing away and has a considerable lead over the team (Essendon) with the next-highest away game average.
There's only one way to be associated with high levels of Entropy and that's to be near-equal favourites in most of the games you play, but there are two ways to be associated with low levels of Entropy and they are to be a frequent underdog or to be a frequent short-priced favourite. GWS and the Gold Coast have achieved their very low levels of average Entropy by following the latter path, Geelong (especially at home) by following the former.
In total, across all games, the average level of Entropy associated with games is 0.836. (The All Team Average shown here is lower because it weights all teams equally, including the Suns and the Giants who've played few games but with much lower levels of Entropy).
The observed distribution of Entropy values across the 1,265 games in the dataset is highly skewed, with 30% of the games carrying Entropy values of about 0.97 or higher, 50% of about 0.90 or higher, and only about 10% with Entropy values or about 0.57 or lower.

Over the past seven seasons, average Entropy values for games suggest three epochs: the first spanning 2006 and 2007 where the average Entropy was about 0.89 in both years; the second running from 2008 to 2010 where the average Entropy fell and was in the range 0.84 to 0.86; and the third taking in 2011 and 2012 where average Entropy fell again to 0.79 and then 0.74.
Not all of the decline in this latest epoch can be attributed to the introduction of the Suns and the Giants. If we exclude all of the games in which they took part, average Entropy still falls from its 2010 levels - to 0.82 in 2011 and then to 0.81 in 2012.
No matter how you spin it, at least as far as the TAB Bookmaker has been concerned, the competition has been getting more predictable in recent times, especially in the past two seasons. This, of course, is completely consistent with the record-high levels of tipping accuracy we've witnessed in these two years.
Does It Matter?
Time then to create some models. All we need is Ordinary Least Squares regression, which we'll use to model Attendance figures as a function of our available regressors.

In the base regression (the left-most column of numbers) the only regressors are designated home team, designated away team, venue and day of week. With these we can form a perfectly acceptable model with a slew of statistically significant co-efficients and an R-squared nudging 77%. Many of the features that we saw in the earlier data analysis for venue and weekday are reflected in the coefficients here: the larger crowds at the MCG and at Stadium Australia, and the larger crowds on Mondays, Tuesdays and Wednesdays.
The coefficient patterns for the teams are a little different and more nuanced, however, as we're now controlling for opponent, venue and day of week. One interesting phenomenon is the ability of interstate teams to pull relatively larger crowds than other teams when playing at home, apparent in the coefficients for Adelaide (implicitly zero), Fremantle, Port Adelaide and West Coast (but, interestingly, not Brisbane or Sydney). Collingwood's, Essendon's and Carlton's ability to pull crowds when playing away from home is also very apparent in the second set of team-related coefficients.
For the next set of coefficients, those headed "Add Home Fav", the only additional regressor is the binary variable denoting whether or not the game has a clear home team favourite. When this is the case it's worth almost an additional 1,400 crowd members. The Home Favourite variable is statistically significant though its inclusion increases R-squared by only 0.13%.
The third set of coefficients now includes the Entropy variable, which turns out to be highly statistically significant. Fans, indeed, do attend in larger numbers when the contest is expected to be close. To put a number to the notion, all other things being equal, the difference in attendance between a game where the head-to-head prices are $5.75 and $1.14 and that same game were the prices to be $1.90 and $1.90 is a bit over 3,000 fans, which is about 9% of the average attendance figure.
Lastly, I wondered if there might be any evidence for a change in fans' reactions to different Entropy levels from one season to the next. The good news for the AFL is that there does indeed appear to have been a reduction in the attendance penalty for reduced Entropy, which has declined by over 15% in the past two seasons. Whether this is a permanent change or just a short-term allowance for the entry of a couple of new teams is yet to be seen.
All of Which Means What?
In the data analysis section we saw that average attendances have fallen this year. One thing that the model allows us to do is to estimate what the per game attendance figures would have been had the competitiveness of the competition, as measured by average Entropy, been at more "normal" levels this season.
If we imagine that the average Entropy for 2012 had been, say, 0.85 bits per game rather than the 0.74 that it was, then we can estimate that the average crowd would have increased by 0.11 x 9,022.9, or about 1,000 per game. (I've been kind and used the all-season Entropy coefficient of 9,022.9 rather than the 2012-specific 7,608.0).
An extra 1,000 attendees per game would go some way to lifting attendances back to their pre-2011 levels, but still leaves, to roll out a sporting cliche, an awful lot to do. Improving the average competitiveness of home-and-away season games will certainly bring more fans back to the game, but, even if this were relatively easy to do (which it isn't) would need to be supplemented with thoughtful changes to the schedule if the ultimate aim were to significantly increase average game attendance figures.
