Defensive and Offensive Abilities : Do They Persist Across Seasons?
/In the previous blog we reviewed the relationship between teams' winning percentages across one or more seasons and found that the relationship was positive and moderate from one season to the next, and tapered off fairly quickly over the course of the next couple of seasons so that, by the time a season was three years distant, it told us relatively little about a team's likely winning percentage in the current season.
There is, of course, an inextricable link between winning and scoring, and in this blog we'll investigate the temporal relationships in teams' scoring in much the same way as we investigated the relationships in teams' winning in that previous blog.
We'll look firstly at the average number of points scored per game by teams then at the average number of points conceded per game.
We know from previous blogs that the rates of scoring have varied markedly and been highly serially correlated across the seasons (the correlation between total points per game in one season compared to the next is +0.358), a phenomenon we need to adjust for if we're to properly investigate team scoring; if we don't, we'll see high inter-temporal correlations that are due mostly to these short-term trends. I'll make this adjustment by subtracting from each team's points scored per game the all-team season mean and I'll refer to the data transformed in this way as having been "centred".
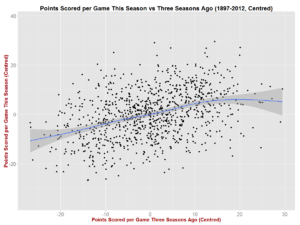
POINTS SCORED PER GAME: THIS SEASON VS EARLIER SEASONS
To the extent that teams are relatively stable in playing and coaching personnel from one season to the next, we'd expect that their relative offensive capabilities would be stable too. This would manifest as a relatively high positive correlation between teams' scoring per game (centred) this season versus last season.
(Please click on the images throughout this blog for larger versions. Each dot in this chart represents the scoring per game [centred] of a single team across a pair of consecutive seasons.)


That correlation, depicted in the chart on the left, is +0.597, which tells us that over 35% of the relative offensive capabilities of a team in the current season can be explained by its relative offensive capabilities in the previous season.
Analysing the relationship by era (see the chart on the right) we find that it was strongest in the 1910 to 1939 era when the correlation was +0.704, and weakest in the 1990 to 2012 era when it fell to +0.454.
When we investigate the relationship between points-scoring in the current season and seasons prior to the previous one, we find, as we did when investigating the inter-temporal pattern of winning percentages, an attenuation in the relationship as seasons become more separated in time.
Here, for example is the relationship between the current season and the season 2 years prior.


Overall, the correlation between a team's scoring per game in this season and its scoring per game two seasons ago is +0.455. By era, the maximum is attained in the 1940 to 1959 era when it's +0.573 and the minimum occurs for the 1990 to 2012 era when it's plummeted to +0.217. In the modern era then it seems that teams can dominate (or languish) for two seasons back-to-back, but a second encore is considerably less likely.
The relationships for seasons separated by three years are weaker still.

The overall correlation is now just +0.386 with the peak era 1897 to 1909 coming in at +0.703, and the low point once again being the modern era where the correlation is just +0.154.
To complete the analysis of teams' scoring, here's each team's time series:

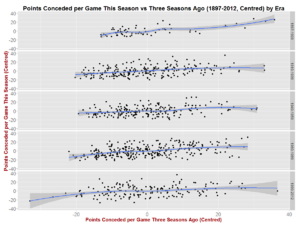
POINTS CONCEDED PER GAME: THIS SEASON VS EARLIER SEASONS
Next we look at team's conceding of points. Again, to the extent that team rosters and coaching staff are retained from one year to the next, we might expect to see inter-temporal stability in teams' relative defensive capabilities.


Indeed we do, and to much the same extent as we saw stability in teams' relative offensive capabilities. The overall correlation is +0.608, effectively the same as the overall correlation for points scored per game this year versus points scored per game last year.
The era view, however, is interestingly different. Whilst there is a clear peak for the 1897 to 1909 era where the correlation is +0.703, the correlations for all subsequent eras, including the most recent, are all quite similar at around +0.600. For whatever reason, it seems that teams in the modern game are as able as they've been for the last 100 years to preserve their relative defensive superiority (or retain their defensive shortcomings) - at least from one season to the next. Quite why there's this asymmetry between teams' ability to preserve relative offensive versus defensive capabilities is a mystery to me.
Next let's look at seasons two years apart.


The overall correlation here is +0.499, slightly but not vastly higher than the equivalent correlation for points scored per game. Again we find a marked peak for the oldest era where the correlation's +0.691 and then similar correlations for all subsequent eras, including the most recent, of around +0.500.
Lastly, the view for seasons separated by three years.

Here the overall correlation is +0.381, the era maximum is +0.663 for the 1897 to 1909 era and there now is some attenuation in the strength of the relationship unique to the most recent era where it's fallen to +0.294.
Here's the time series of points conceded per game for each team:

POINTS SCORED PER GAME VS POINTS CONCEDED PER GAME IN THE SAME SEASON
Before we leave this deep-dive into the history of team scoring I want to also explore a question that's been intriguing me for a while: how contemporaneously correlated are teams' offensive and defensive capabilities.

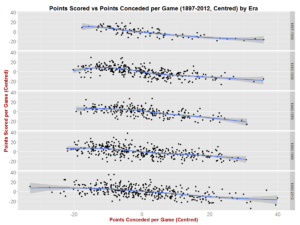
The overall correlation is fairly large in absolute terms and stands at -0.574, meaning that about one-third of a team's variability in relative offensive capability is shared with its variability in relative defensive capability. To a moderate extent then, teams tend to be weak or strong defensively and offensively at the same time.
Across the eras we find that the magnitude of this correlation has been falling. It peaked in the first era at -0.769, had fallen to -0.514 in the 1960 to 1989 era, and stands now at -0.529 in the most recent era.
The relationship between points scored and points conceded differs somewhat by team, as the follow chart depicts.

The final table (below) quantifies the linear strength of these relationships for each team (see the rightmost column) and reveals that it's strongest for the Brisbane Lions (based on a relatively small sample), but also strong for the Hawks, Port Adelaide and St Kilda.
The other columns in this table provide information about the strength of the various other relationships investigated in this and in the previous blog. It's interesting to note the broad similarities in the correlational patterns for all teams when we compare the data for winning percentages, points scored per game and points conceded per game, especially for teams with a fairly large sample of seasons from which to draw conclusions. Hawthorn and St Kilda stand out as teams whose performances, no matter whether you measure them by victories, points scored or points conceded, show a great deal of consistency across successive seasons.

