A First Look At Surprisals for 2011
/We first discussed surprisals back in 2009 (if you perform a site search using the term "surprisals" you'll be linked to a couple of PDFs as well as to a handful of blog posts on the topic) as a method for quantifying the surprise associated with the outcome of a football game.
The surprisals associated with a head-to-head result we defined as:
RS = -log(Probability of victory associated with the winning team pre-game) [where the log is base 2].
One way of conceptualising surprisals defined in this way is that a result producing N surprisals is as surprising as N tossed coins all coming down heads.
The chart below shows how RS varies with the favourite's price assuming a 107% overround.

So, for example, in a game with a favourite priced at $1.10 - for which, with a 107% overround, the underdog would be priced at about $6.25 - an underdog victory would produce about 2.73 bits of surprisal and a favourite victory only about 0.24 bits of surprisal.
For any given game we can also think about an expected value for RS - how surprised we should expect to be at the end of the game, if you like, or how much information the game result is likely to provide us with. In a game with a $1.10 priced favourite, the favourite is about an 85% chance of victory, so the expected RS for this game would be 85% x 0.24 + 15% x 2.73, which is about 0.61 bits.
Contrast this with a game where we have two equal favourites priced at $1.87. In that game we're guaranteed to produce 1 bit of surprisal since either team's victory will produce this result. So, the outcome of a game between two evenly-matched teams provides us with more information - about 0.39 bits more information - than we expect to glean from the outcome of a game between a $1.10 favourite and a $6.25 underdog. Of course, if the $6.25 underdog wins we get a lot more information - but that's expected to happen relatively rarely.
So, that's how we estimate the surprise associated with a head-to-head result, that is, who wins and who loses. How might we go about estimating the surprise associated with the victory margin?
Previously, to measure the surprisals of a (handicap adjusted) victory margin I've used the fairly clumsy approach of grouping margins into ranges and associating probabilities with that range. In doing this I've missed a far simpler approach made possible by the fact, demonstrated previously, that HAMs are approximately Normally distributed with a mean of 0 and standard deviation 37.7 points.
Knowing this, we can define handicap adjusted margin surprisals analgously to result surprisals thus:
HS = -log(Probability of Actual Handicap Adjusted Margin) [NB again the log is base 2]
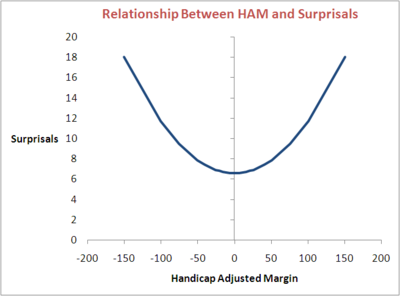
Now the most likely HAM in a game is 0 (well, actually of -0.5 or +0.5), assuming the bookie got the handicapping right, for which HS is about 6.5 bits.
Why is this so high?
Well, if you think about it, any particular handicap adjusted margin is actually quite unlikely. That's why, for example, the smallest price on offer from TAB Sportsbet for predicting a victory margin spanning 2 points is $26. If we assume that after removing the overround this should be say $35, then this equates to a probability of about 2.8% for the two margins combined. Let's further assume that this is 1.4% on each of the two margins within the range and calculate -log(1.4%) base 2. We get about 6.2 bits.
So, even the most likely victory margin is relatively unlikely in probability terms and so relatively quite surprising, or 'surprisalfull' if you prefer.
As we move away from HAMs near zero we reduce the likelihood of their occurrence and lift the associated surprisals, slowly at first, but more rapidly as HAMs become especially large.
Enough of the theory then - on to some practical applications.
Firstly, let's calculate average result surprisals for the round-by-round results since 2006.
Notice how short the three rightmost bars (ignoring the bar at the very far right) are for 2011. These bars correspond to the average RS for Rounds 18, 19 and 20, which you'll recall have been rounds characterised by victories for short-priced favourites.

There are some taller bars for the rounds of 2011, but overall they've been shorter this year than in any other year shown in the table, as is reflected by the relative shortness of the bar furthest right in the row for 2011, which depicts the average RS per game for the whole season.
Better than trying to discern the relative heights of these rightmost bars is to look at the column of numbers next to them, which provide the numerical evidence. In 2011 the average game has produced only 0.73 bits of surprisal. That's about 0.09 bits fewer than the next-lowest season average, and 0.11 bits fewer than the all-season average.
The dollar values at the far right of the table show the average head-to-head price of the winning teams. Here too the relatively unsurprising nature of the game results of 2011 is apparent. In short, this season favourites have won a lot.
Whilst the winners of many games have seemed predestined this season, my suspicion, prior to completing this analysis was that the margins have been far more surprising.

Indeed they have been, though it does depend on your preferred measure. If you use the HAM Surprisals measure, this season's average of 7.30 is the highest since 2006 and is 0.04 bits per game higher than the all-season average.
If, instead, you consider the average absolute handicap adjusted margin, then this season appears to have produced a far less surprising set of handicap adjusted margins.
It all comes down to how much influence you allow the extremely large HAMs we've seen throughout season 2011 to have on your measure of surprise. Our handicap adjusted surprisal measure weights very large HAMs more heavily than does the average absolute HAM measure.
In any case, which teams have been the source of this season's surprise?
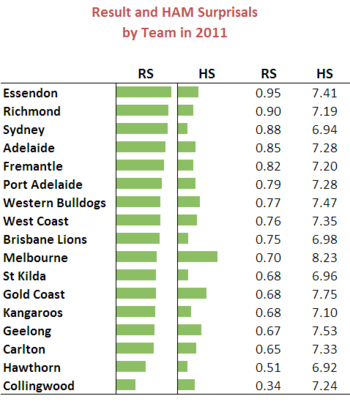
Essendon leads out as the team having been involved in games that, on average, have produced the greatest level of surprisals so far this season. Its Round 11 loss to Melbourne and Round 15 victory over Geelong each were associated with over 2 bits of surprisal.
Other teams that have produced surprising head-to-head results have been the Tigers, Swans and Crows.
Collingwood, Hawthorn, Carlton and Geelong - the competition front-runners - have all produced relatively little surprise in their head-to-head results so far this season.
The picture for HAM Surprisals is quite different. Here it's the Dees, Suns and Cats that have produced most surprise, in the Dees' and Suns' cases by losing more spectacularly than was expected, and in the Cats' case by winning more comfortably.
Hawthorn, Sydney and St Kilda are the teams with the lowest production of surprisal bits from a handicap adjusted margin point of view.
