Tipping Without Market Price Information
/In a previous blog I looked at the notion of momentum and found that Richmond, St Kilda, Melbourne and Geelong in particular seemed to be "momentum" teams in that their likelihood of winning a game seemed to be disproportionately affected by whether they'd won or lost their previous match. Virtually every team exhibited a "form" or "momentum" effect to some degree.
Here's an update of the analysis, now including both the 1999 and 2010 seasons, and now also looking at the momentum effects of the previous two matches, not just one.

Not surprisingly, the results in the first three columns are much as before. Richmond, for example, still shows strong momentum-induced tendencies in that they win about 37% of the time overall, but about 50% of the time when they've won their previous game (and, as we see here for the first time, about 44% of the time when they've won their previous two games, making them, along with Sydney, the only teams in the competition less likely to win after two straight victories than after one).
Overall, teams that have won their previous game are 4% more likely to win, and teams that have won their previous two games are 10% more likely to win. Single and paired losses have much the same-sized effect, but in the opposite direction.
Refreshing this analysis got me to wondering once again about the predictive power of previous results alone, which is a topic I danced around in an earlier blog but which, to my recollection, I've not previously addressed directly.
Put simply: how accurately can the results of games be predicted based solely on the competing teams' recent form?
To answer this I built a series of binary logit models where the target variable was the home team result, win or loss (draws being excluded from the analysis), and the regressors were each team's recent win/loss record in percentage terms, or in terms of points for less points against. With these models I calculated how accurately each of them predicted the results across 1999 to 2010.
Here are the results:
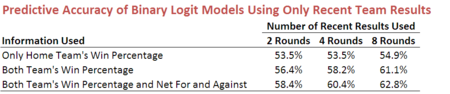
As an example, using only the Home team's win percentage as measured over the past 1 and the past 2 rounds, the fitted model predicts at 53.5%, comfortably better than chance but not extraordinarily so. (A team's win percentage for the last round will be 100% if it won its previous game, 0% if it lost, and 50% if it drew. Its win percentage over the last 2 rounds will be 100% if it won both games, 0% if it lost both, and 50% if it won one and lost one or drew both.)
Moving down the first column, for the second entry the Away Team's win percentage for the most recent and the two most recent games was included. This lifted the predictive accuracy to 56.4%. To be clear, this means that using just five pieces of information - which team is at home, and the home team's and the away team's last 2 results (win, lose or draw) - we can tip at over 56%.
If we then include information about the margin of those results for the Home and the Away team in the form of the total points for less the total points against, the resulting model tips at 58.4%.
Accuracy climbs further still as we add more historical result data. Using the win percentage and net for an against data for each of the last 4 rounds for both teams, we can tip at 60.4%; using the last 8 weeks', we can tip at 62.8%.
Clearly there's a significant amount of information in a team's recent form.
One thing to note is that models drawing on a longer historical period are fitted to fewer games. For example, the model that uses the previous 8 rounds of data is not fitted to the first 8 weeks of any season since I've not allowed the historical win percentage and for and against summaries to reach back into previous seasons. You might then reasonably argue that such models have a slight advantage because they're not forced to tip in the early rounds of the season when form can be less of a guide and results can be harder to predict.
