Winners' Share of Scoring
/You might recall from seasons past my commenting on what I've claimed to be a startling regularity in AFL scoring, specifically, the proportion of scoring shots recorded by winning teams.
In 2008, winning teams racked up 57.3% of all scoring shots, while in 2007 the figure was 56.6%, and in 2006 it was 56.7%. Across the period 1999 to 2008 this percentage bounced around in a range between 56.4% and 57.8%. By any standard that's remarkable regularity.
I've recently come into possession of the scores for the entire history of the VFL/AFL competition in a readily analysable form - and by now you surely now how dangerous that's gotta be - so it seemed only natural to see if this regularity persisted into earlier seasons (assuming that it makes sense for something to persist into the past).
Below is a chart showing (in purple) the percentage of scoring shots registered by winning teams in each of the seasons 1897 through 2008. (The red line shows the proportion of goals that they scored, and the green line shows the proportion of behinds.)
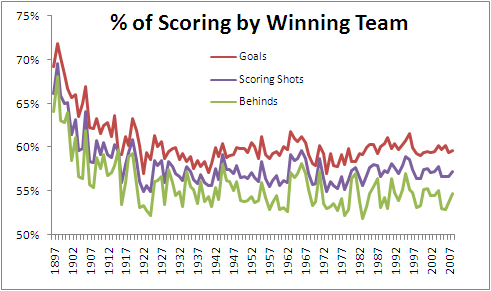
So, apart from the more extreme dominance of winning teams in the first decade or so of the competition, and a few other aberrant seasons over the next two decades, we have certainly seen remarkable stability in the percentage we've been discussing. Indeed, in the period 1927 to 2008, the percentage of scoring shots registered by winning teams has never been outside the range 55.0% to 59.6%. That surely almost establishes this phenomenon as a Law of Footy.
For those of you who prefer to digest your data in tabular form (preferably taken with meals), here's a decade-by-decade summary of the data.

The recent peak in winning teams' share of scoring was witnessed in 1995 and it came not as a consequence of a spike in 6-pointer dominance but instead from a spike in winning teams' share of behinds. In 1995 winning teams scored 57% of all behinds, which is about 2-4% higher than anything we've witnessed since. 1995 was the year that Carlton won the minor premiership kicking 317 behinds, Geelong finished runners-up kicking 338, and Richmond and Essendon, finishing in 3rd and 4th, kicked 600 more between them. By way of context, that's almost 75 more behinds than the top 4 of Geelong, Hawthorn, Western Bulldogs and St Kilda managed in 2008.
Regularity also aptly describes the history of the percentage of goals kicked by winning teams across the seasons (the red line in the chart). Again looking at the entire period since 1927, this percentage has never strayed from the righteous range of 57.0% to 61.8%.
Winning teams' share of behinds (the green line) has been, relatively speaking, quite variable, ranging from 51.9% to 58.2% in the period 1927 to the present, which once again demonstrates that it's goals and not behinds that win footy games.
