Simulating the Finalists for 2013 : Post Round 22 - An Alternative Approach
/As I alluded to in the previous blog, team differential is not an ideal proxy for team percentage right now and will, in some instances, lead to misleading simulation results. There are teams that might, when the final home-and-away round is complete, finish equal on points with another team, have a superior points differential, but also have an inferior percentage. In that case, the approach I've used for my simulations would arrive at an incorrect team ordering.
As the most obvious practical example of where this is a problem - as I noted in the previous blog - using differential rather than percentage has resulted in my estimates of the Dees' and the Giants' Spoon prospects being mis-estimated. That fact has been irking me ever since I posted the earlier blog, and being irked is often a catalyst for my finding a better way.
And so it was this week that I discovered I could jointly estimate the scoring of the home and away teams separately using the lavaan package, and not be forced to estimate only the difference between those scores.
Using the data for season 2013 only, lavaan gave me the following set of estimated equations:
- Home Team Score = 0.317 x Home Team MARS Rating - 0.445 x Away Team MARS Rating
- Away Team Score = 0.399 x Away Team MARS Rating - 0.508 x Home Team MARS Rating + 1.028 x Away Team Venue Experience
(I tried a number of other formulations, including some with Home and Away Team Venue Experiences, but eventually settled on this model. Perhaps in a future blog I'll write more about the process of selecting this model.)
I can use these equations to come up with expected scores for the Home and the Away teams in the season's remaining fixtures, simply by inputting the teams' current MARS Ratings and by determining the Away team's Venue Experience in each game. Here's what that approach produced for the final round of the 2013 home-and-away season.
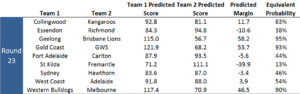 In this table, the Predicted Margins (and hence Equivalent Probabilities) are similar in magnitude and identical in sign to those we used for the previous blog.
The lavaan package also estimates the residual variance and covariance of the Home and Away team scores (ie the variance and covariance about the estimated means of each game in the sample set), which we can use as input to the rvnorm function in the mvtnorm package, along with the estimated mean Home and Away team scores in each game, to generate simulated Home and Away team scores for the nine remaining games.
(The residual variance of Home Team score was estimated as 456.24 points squared and of Away Team score was estimated as 543.30 points squared. These are equivalent to standard deviations of about 21.4 and 23.3 points respectively. The covariance was estimated as -40.79, which implies a correlation of -0.08 - a surprisingly small value, I'd suggest. Team scoring is not, it seems, a zero sum game - at least to any great extent. When one team scores more than they were expected to this does not imply that their opponents will score (much) less than they were expected to.)
The model provided by lavaan explains an impressive 35% of the variability in Home Team scores this season, and an even more impressive 40% of the variability in Away Team scores.
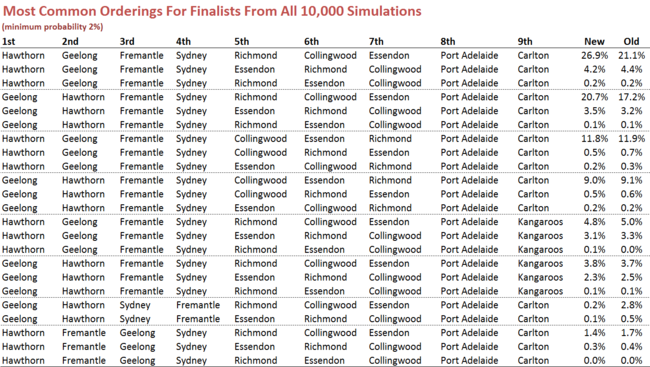
If we take lavaan's estimates of expected Home and Away team scores for each game and use its estimate of the residual variance-covariance matrix for every game - repeating this process 10,000 times, as is the custom here - we get the following results.
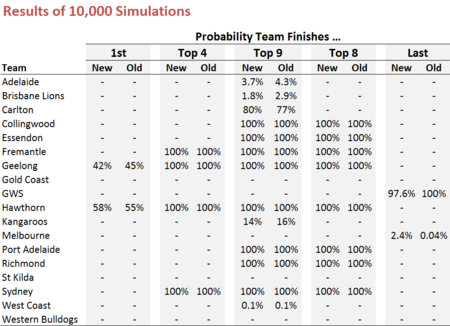 Data in the columns headed New come from this latest set of simulations, while that in the columns headed Old are what was presented in the earlier blog.
The most notable difference is, as I'd hoped, in the estimate of the Dees' Spoon prospects, which increases from near zero in the previous set of simulations to about 2.4% here.
There are also some reassessments of team chances in the race for the Top 9, though the changes are only small. The Crows', Lions' and Roos' chances shrink, the Eagles' stay much the same (and equally as forlorn), while the Blues' chances increase by about 3%.
In the race for the minor premiership, the new simulations rate the Hawks as slightly better chances.
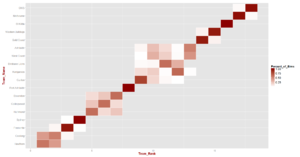
Here are the probability density and heat maps for the new simulations, which are broadly similar to those of the earlier simulations.
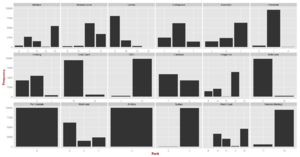
For completeness, here are new versions of all other charts from the previous blog.
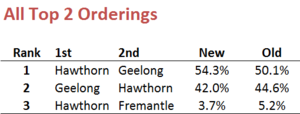
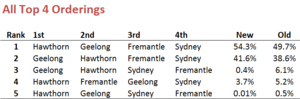
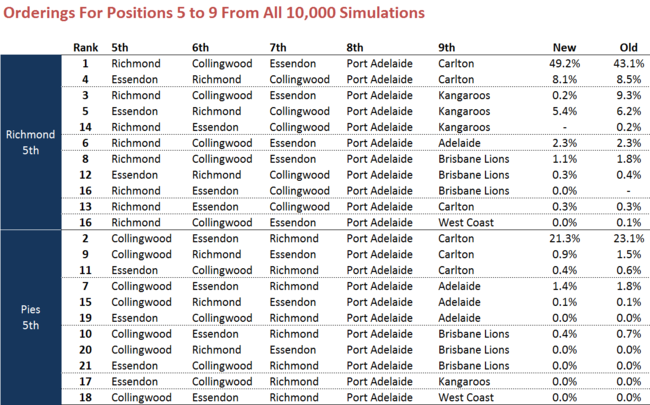
 Generally, and reassuringly, the results are very similar, differing only where the distinction between differential and percentage has the potential to make a significant difference.
To me, what's been most pleasing about this exercise has been the realisation that there's a viable way to predict not just expected game margins, but individual team scores as well. Expect to read more about this is coming blogs.