AFLW 2026- Round 8 Results - Another Nibble
/WoSHBODS tipped 5 from 9 winners this week, as did the bookmakers.
Its Margin MAE was 17.1 points per game, compared to 16.7 and 17.3 for the two bookmakers, and its Total MAE was 22.8 points per game, compared to 17.8 for the two bookmakers.
Lastly, WoSHBODS’ LPS of +1.4 bits compares to +1.8 bits for the two bookmakers.
One small step for a man …
WAGERS
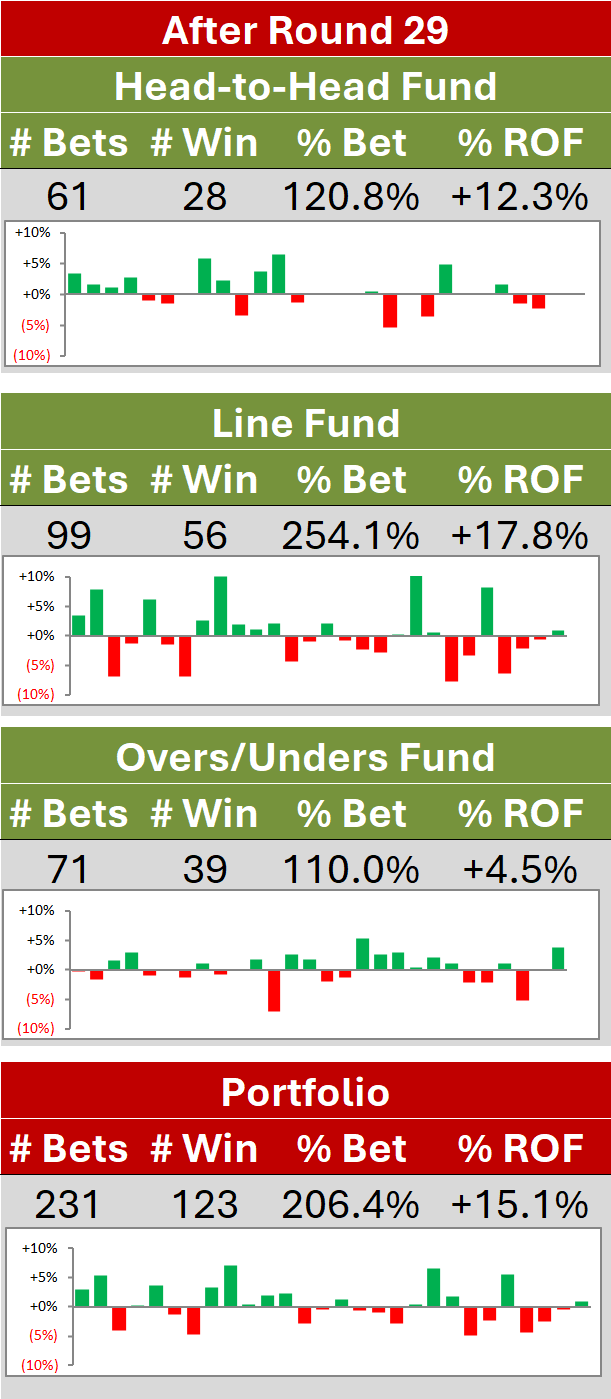
Both the Line and Under/Over Funds made money this week, which was enough to lift the Combined Portfolio by just over 1c on the round leaving it now down by just over 6.4c on the season, that from a -6% ROI on a 1.08 turn.
(Eagle-eyed followers might have noticed some small changes to the profit and loss figures for earlier rounds. They’ve arisen because of Excel formula errors in those rounds. Essentially I copied formulas from cells where I’ve had to piecemeal calculate profitability because I have different prices for different parts of the wager, to cells where I should have just used a simple formula because I have a single price for the entire amount wagered. The final total difference is relatively small, though net positive.)
TEAM DASHBOARD
Below is a table recording how the teams rank on various Team Dashboard metrics.
The metrics most rank correlated with ladder position are:
MoS Win Production Function: +0.97
Own Goals per Game: +0.94
Own Points per Game: +0.93
Percentage of Quarters Won: +0.93
Own Scoring Shots per Game: +0.86
Opponent Goals per Game: +0.83
Opponent Points per Game: +0.82
Opponent Scoring Shots per Game: +0.79
Q4 Performances: +0.74
Q1 Performances: +0.72
Q2 Performances: +0.7
The metric least rank correlated with ladder position is:
Opponent Scoring Shot Conversion: +0.34
Note that the teams currently in the Top 8 on the competition ladder are also in the Top 8 on the WoSHBODS WPF and on percentage of quarters won.
Next come the details of the Team Dashboard in two parts.
In the top part we can see that the Top 9 teams represent 74% of all wins.
We can also see that Geelong has scored an average of more than 10 goals a game and conceded about 7 goals, while Melbourne and North Melbourne have scored 9 but conceded only about 3 to 4. St Kilda has scored about 3 per game and conceded almost nine.
In the bottom half we see that:
North Melbourne has won 25 of 32 quarters this season. Melbourne is next with 22, then Geelong with 21.
Over the same time period, Collingwood and St Kilda have won only 8 quarters, and Essendon just 9.
The teams that have outscored their opponents, on average, in every quarter are Carlton, North Melbourne, and Melbourne, Fremantle have done it for Q1 to Q3, but fall away dramatically to record a percentage of just 42 in final terms. They have scored only 12% of their total in Q4s and converted at only 38%
Those that have been outscored by their opponents, on average, in every quarter are Collingwood, Essendon, and St Kilda
Western Bulldogs have scored only 13% of their points in Q3s, Hawthorn 15% in Q2s, and North Melbourne 15% in Q1s
Collingwood and Western Bulldogs have conceded 38% of their points in Q3s, West Coast 36% in Q2s, and Carlton 36% in Q2s