In the previous blog I reported that:
the TAB Bookmaker can be thought of as a Bookmaker with zero bias and a 5-5.5% sigma, and the Head-to-Head Probability Predictor can be thought of as a Punter with a +1-2% bias and a 10-12% sigma
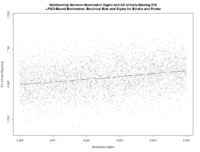
Simulating these parameter ranges, with an LPSO-like Bookmaker and with his overround varying in the range 5% to 6.5%, reveals that the return to Kelly-staking for a Punter with Bias and Sigma in these ranges (who, unlike MAFL's Head-to-Head Fund, wagers on Away as well as Home teams) is positively related to Bookmaker Sigma ...
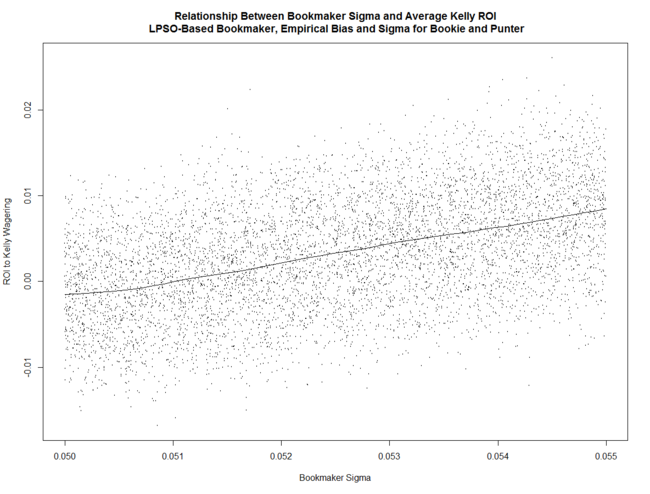
(Note that if Bookmaker Sigma is around 5% the expected return to Kelly-staking is negative.)
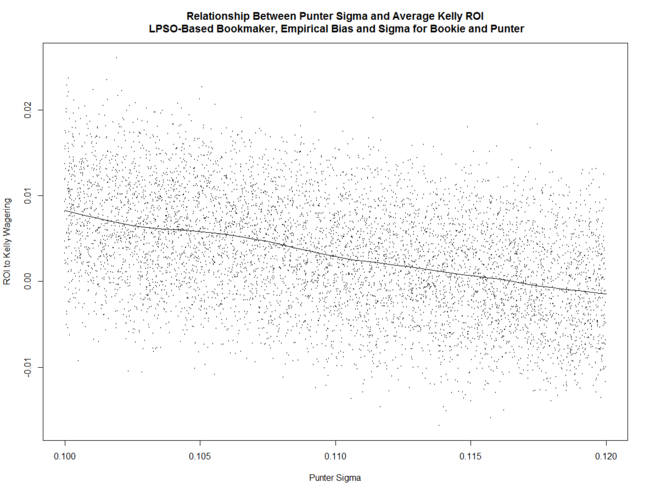
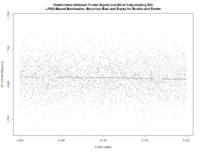
The Punter's ROI is negatively related to his Sigma ...
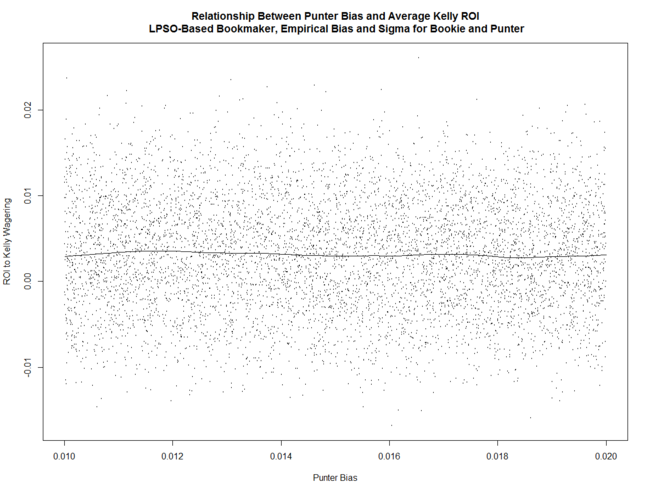
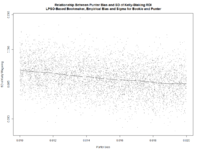
 ... and pretty much unrelated to his Bias.
These relationships are all similar to what we found in earlier blogs in which the parameter space investigated was much larger.
What's also interesting is that the variability of the returns to Kelly-staking is positively related to Bookmaker Sigma, broadly unrelated to Punter Sigma, and negatively related to Punter Bias.
(Note that these images can be clicked for larger versions.)
We also find that, for every set of parameters in the simulation, the expected return to Kelly-staking exceeds that for Level-staking, which is broadly consistent with what we found when exploring the larger parameter space, but the correlation between the average Log Probability Score and the ROI to Kelly-staking is, in absolute terms, always lower than the correlation between the average Brier Score and the ROI to Kelly-staking, which is contrary to what we found when exploring the larger scenario space.
Using RWeka to create simple rules for when to Kelly-stake and when to beat a considered retreat from wagering, the first few rules we're offered are:
- If the Total Overround is less than 5.88% and the Bookmaker Sigma exceeds 5.24%, then the best strategy is to Kelly-stake, otherwise
- If the Total Overround is less than 5.63% and the Punter Sigma is less than 11.00%, then the best strategy is, again, to Kelly-stake, otherwise
- If the Total Overround is greater than 6.18% and the Bookmaker Sigma is less than 5.27%, then the best strategy is not to bet, otherwise
- If the Total Overround is greater than 5.34%, the Punter Sigma is less than 10.73%, and the Bookmaker Sigma exceeds 5.14%, then the best strategy is to Kelly-stake, otherwise
- If the Total Overround is less than 5.44%, then the best strategy is to Kelly-stake
For about 70% of the remaining scenarios the recommendation is not to bet.
Using Eureqa's Formulize to build a model of the ROI to Kelly-staking, we find that one of the best-fitting models, with an R-squared in excess of 85%, is:
- Expected Kelly ROI = 2.143*Bookie Sigma - Bookie Total Overround - Bookie Sigma*Punter Bias - 0.463*Punter Sigma
This suggests that, as we've found previously, the ROI to Kelly-staking is heavily dependent on the Bookmaker's precision and, to a lesser extent, on the Punter's. As well, the ROI to Kelly-staking drops percent-for-percent with the Bookmaker's Total Overround.
And, finally, using Eureqa's Formulize to build a model of the standard deviation of the ROI to Kelly-staking, we find that one of the best-fitting models, but with an R-squared of only around 16%, is:
- Expected SD Kelly ROI = 0.067 + 0.415*Bookie Sigma - 3.600*Punter Bias*Bookie Total Overround
So, not only does the expected return to Kelly-staking rise with the Bookmaker's Sigma, so too does the variability of that return. In addition, variability falls with Punter Bias and with the Bookmaker's Total Overround.
SUMMARY
This blog addresses Bookmaker vs Punter scenarios that we are, based on empirical data for the TAB Bookmaker and MAFL's Head-to-Head Fund algorithm, most likely to encounter in practice, and shows that there is a fairly narrow range of scenarios - where Bookmaker Sigma is sufficiently high, and Bookmaker overround and Punter Sigma are sufficiently low - for which the expected profit to Kelly-staking is positive.
It also suggests that, within the range of parameter values explored, the variability to Kelly-staking grows with Bookmaker imprecision and shrinks with the product of Punter Bias and Bookmaker Overround.